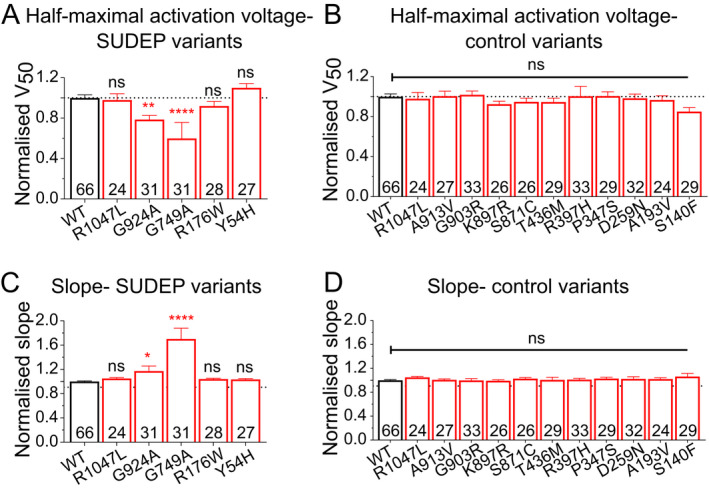
FIGURE 3.

Biophysical properties of KCNH2 variants from SUDEP cases and epilepsy control population. (A) Average half‐maximal voltage of activation for each variant in SUDEP cohort. (B) Average half‐maximal voltage of activation for each variant in the epilepsy control cohort. (C) Average slope from the Boltzmann fit for each variant in the SUDEP cohort. (D) Average slope from the Boltzmann fit for each variant in the epilepsy control cohort. Number in each bar represents the number of independent oocytes recorded for each variant. *p < 0.05, **p < 0.01, ****p < 0.0001.
