
FIGURE 1.
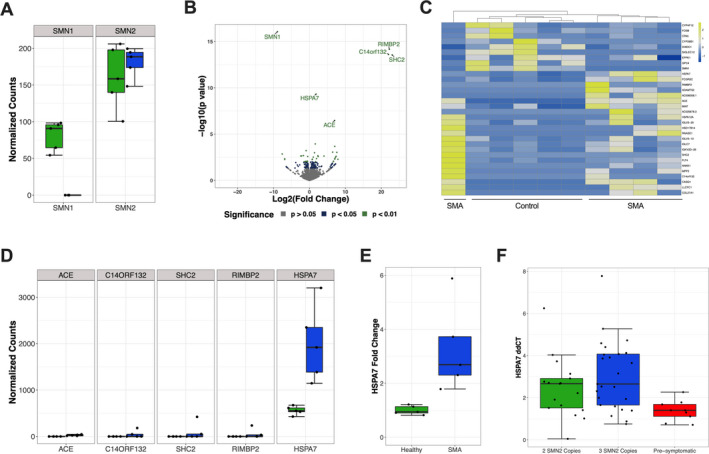
RNA sequencing reveals increased HSP70B mRNA levels in the whole blood of SMA Infants. (A) Negative binomial normalized read counts of SMN1 and SMN2 genes in SMA versus healthy controls. Green indicates control subjects, while blue indicates SMA subjects. (B) Volcano plot comparing SMA and control subjects. (C) Heatmap plot of normalized counts for genes with p < 0.01 and an absolute value of log2 fold change > 1.2. (D) Normalized counts of SMA and healthy patients for differentially expressed genes with FDR < 0.2. Green indicates control subjects, while blue indicates SMA subjects. (E) Quantitative RT‐qPCR for HSPA7 mRNA levels. p = 0.02. (F) HSPA7 mRNA levels in a cohort of SMA patients divided into symptomatic SMA subjects with only two SMN2 copies, symptomatic SMA subjects with three SMN2 copies, and pre‐symptomatic SMA subjects with three SMN2 copies. p = 0.01 and p = 0.003 when comparing pre‐symptomatic SMA subjects with symptomatic SMA subjects with only two SMN2 copies and symptomatic SMA subjects with three SMN2 copies, respectively.