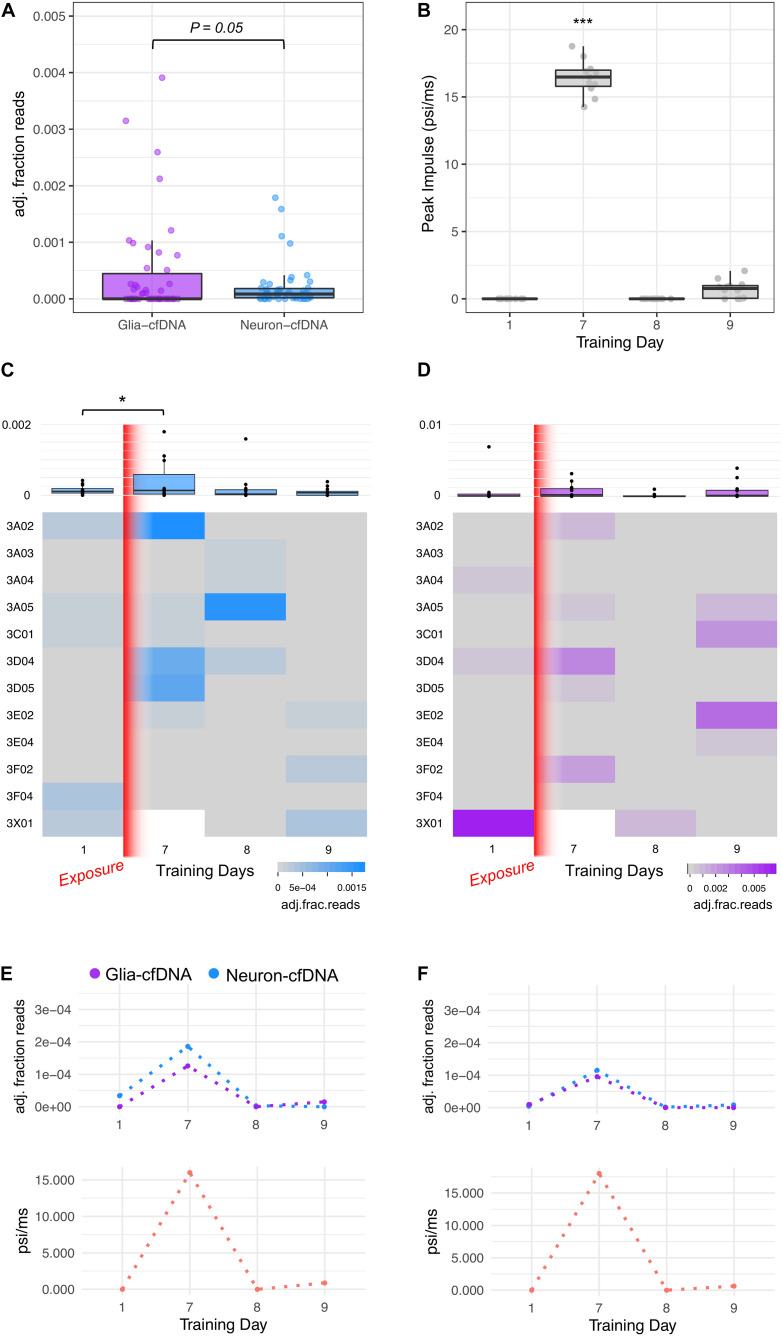
FIGURE 3.
Glia- and neuron-cfDNA measurements within 47 breacher blood plasma samples. (A) Boxplot of glia-cfDNA and neuron-cfDNA measurements within breacher samples, measured as adjusted fraction of sequencing reads (adj. fraction reads). (B) Boxplot of peak impulse exposure (psi/ms) measurements of breachers on training days 1, 7, 8, and 9 recorded by pressure monitoring devices mounted on each subject. (C) Heatmap and boxplots of the neuron-cfDNA measurements across days 1, 7, 8, and 9 of training. (D) Heatmap and boxplots of the glia-cfDNA measurements across days 1, 7, 8, and 9 of training. (E,F) Longitudinal glia and neuron-cfDNA measurements (top) and peak impulse exposure (psi/ms) of two breacher subjects with highest neuron-cfDNA levels. *p = 0.03 and ***p = 3.1 × 10⁻¹³.

