FIGURE 2.

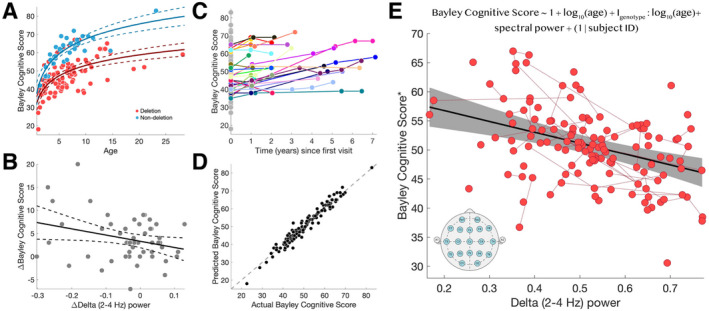
Delta power predicts cognitive function. (A) Both log10(age) (P < 10−31) and genotype:log10(age) interaction (P < 10−12) predict cognitive function. Each circle indicates a subject visit. The solid [dashed] curves indicate model fit [95% confidence intervals]. Subjects with deletion [non‐deletion] genotype are indicated in red [blue]. (B) Amongst longitudinal subjects (N = 27 subjects, N = 51 pairs), change in delta power predicts change in the Bayley Cognitive Score (R 2 = 0.0814, P = 0.0386, β = −13.40 [SE 6.30]). (C) Subjects had similar cognitive scores across longitudinal assessments, with different baseline values (e.g., y‐intercepts). Connected points in color indicate longitudinal data from the same subject. Points in gray indicate subjects with only one visit. (D) The observed Bayley Cognitive Scores and the Bayley Cognitive Scores predicted by the model were highly correlated (R 2 = 0.9374), indicating a good model fit. Each circle indicates a real and predicted subject score. The dashed line indicates identical values between the two scores. (E) There is a linear relationship between delta power and the Bayley Cognitive Score after controlling for age, age: genotype interaction, and repeat visits using the mixed‐effects model shown at the top of the panel (R 2 = 0.9374, delta power P < 10−5, log10(age) P < 10−24, genotype:log10(age) P < 10−11, repeat subjects P < 10−8). The solid black line shows the model fit and the gray shaded region indicates the 95% confidence intervals. Red circles indicate combined EEG and cognitive score visits. Red lines indicate repeat visits by the same subject. The insert shows the standard 10–20 EEG channels used to estimate delta power. *The Bayley Cognitive Score has been adjusted for a fixed age and genotype for visualization.
