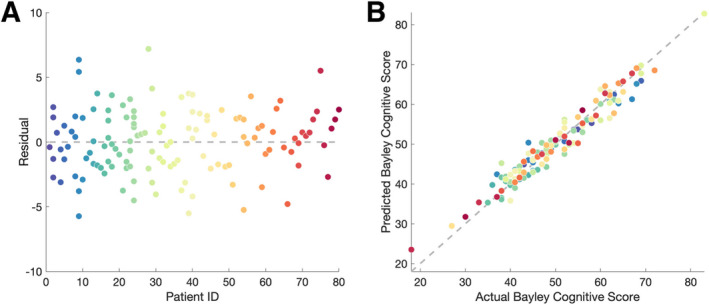
FIGURE 3.

Model validation. (A) The residuals are normally distributed, with a low root mean squared prediction error (RMSPE = 2.50). (B) there is a strong correlation (R 2 = 0.9455) between the actual and predicted Bayley Cognitive Score values for each excluded subject, indicating a good model fit. Each circle indicates a subject visit and colors represent the same subject in (A) and (B).
