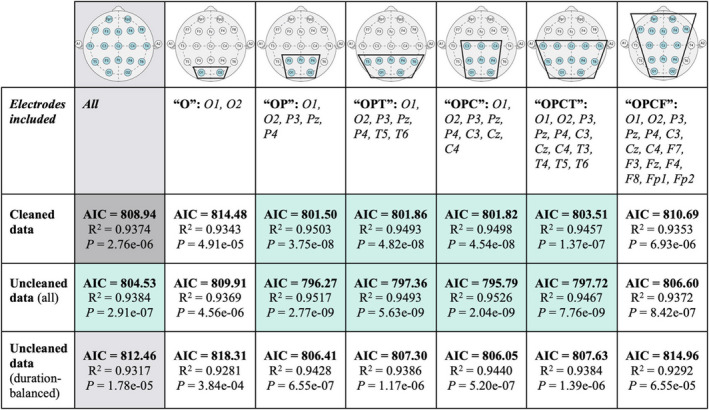
FIGURE 4.

Sub‐sampled electrode clusters and raw EEG data predict cognitive function in AS. Sub‐sampled clusters of electrodes are shown in the first row (blue = channel included in montage), with the groupwise abbreviation and the names of channels included listed in the second row. The full average reference is shown in the second column in gray for comparison, and cleaned data in the full average reference, to which all other cells are compared, is shown in dark gray. For each of the sub‐sampled channel montages, and the full average reference, relative delta power was computed using cleaned, raw, and raw data with balanced duration to cleaned data, and used to predict the Bayley Cognitive Score. Cells with AIC scores superior (ΔAIC > 4) to those from the model using cleaned data from all electrodes in the full average reference are highlighted in green.
