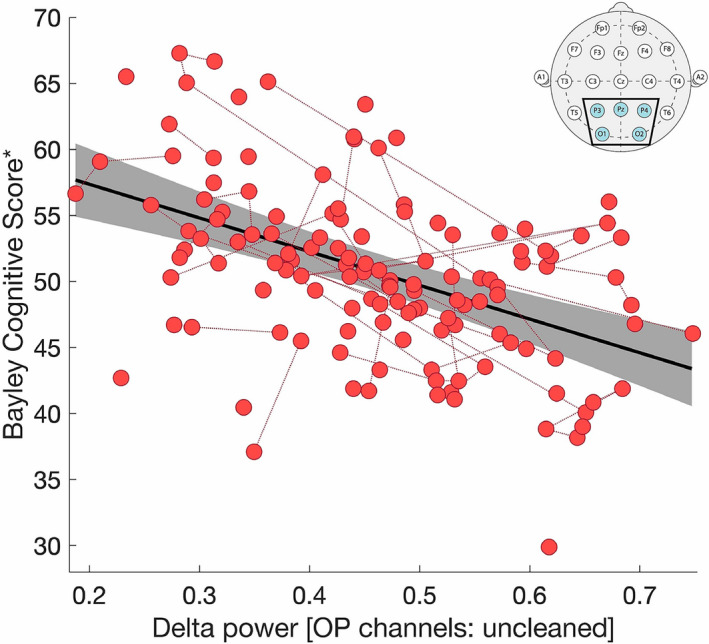
FIGURE 5.

Delta power calculated from raw data in the OP montage predicts cognitive function. There is a linear relationship between delta power, estimated from raw data in the OP montage (inset), and the Bayley Cognitive Score after controlling for age, age:genotype interaction, and random effects for repeat subjects (R 2 = 0.9517, delta power P < 10−8, log10(age) P < 10−22, genotype:log10(age) P < 10−12, repeat subjects P < 10−8). The solid black line indicates the linear model fit, and the gray shaded region indicates the 95% confidence interval. Longitudinal same‐subject data are connected by red dotted lines. *The Bayley Cognitive Score has been adjusted for the impacts of age and genotype and the recast values plotted.
