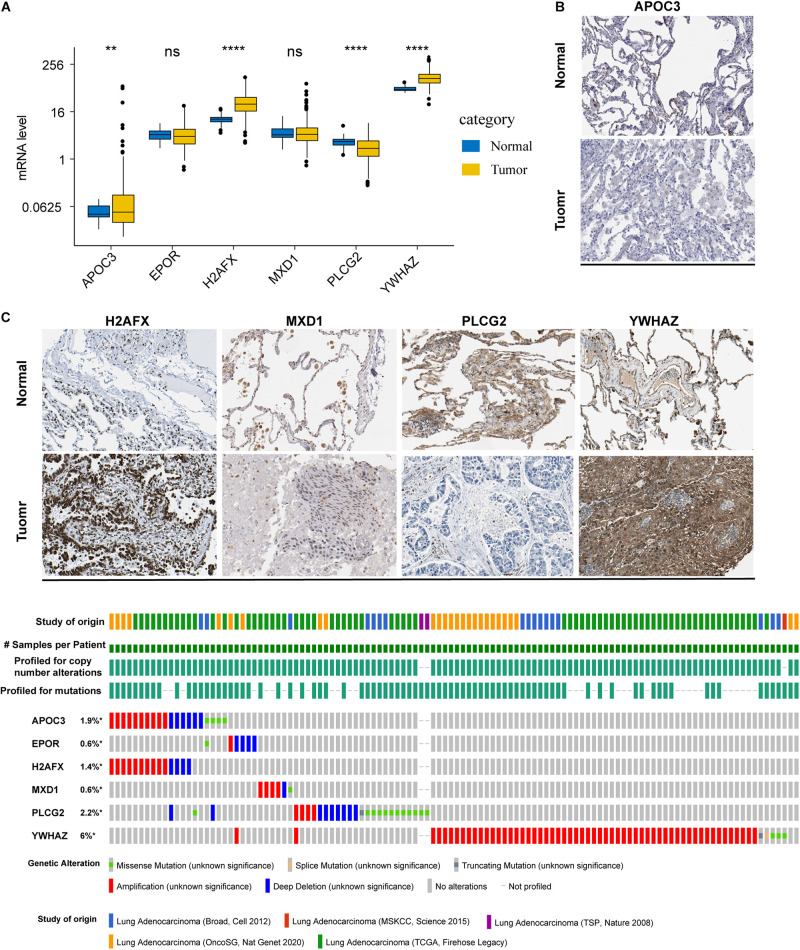
FIGURE 2.
mRNA and protein expression profile and alterations of the ARGs in LUAD. (A) The mRNA expression profiles of ARGs between normal and tumor tissues in the training set. **P < 0.01 and ****P < 0.0001. (B) Representative immunohistochemical pictures of ARGs protein expression which were obtained from the Human Protein Atlas database (the data of EPOR were not available). (C) Genetic alterations in the ARGs in LUAD were determined using the cBioPortal database. *P < 0.05.

