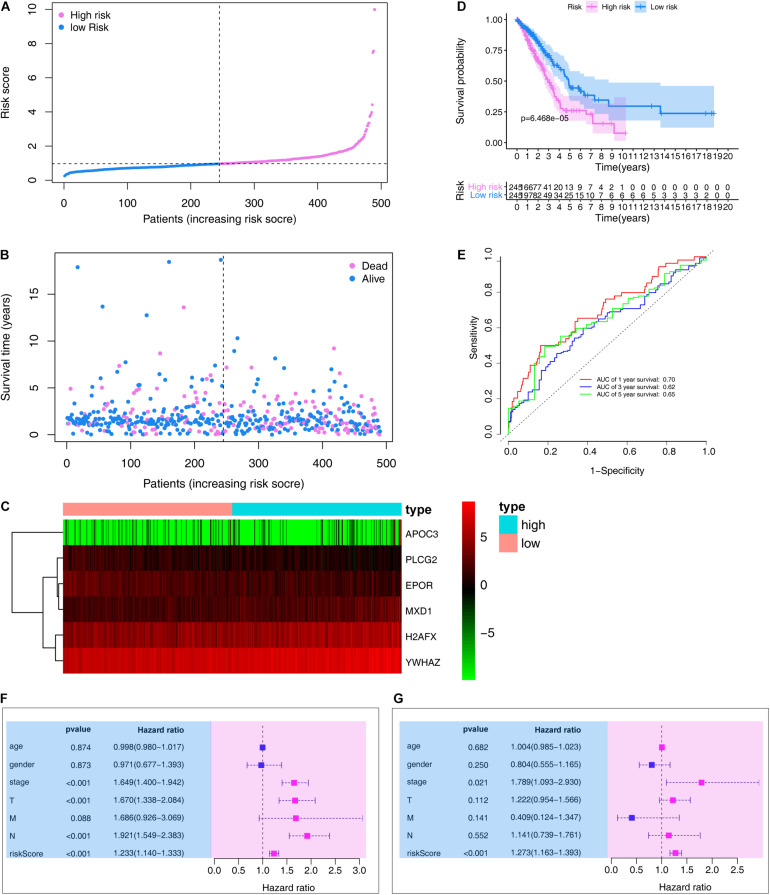
FIGURE 4.
Evaluation the prognostic value of the ARG signature in the training set. (A) Distribution of the risk scores calculated by the risk score. (B) Patient distribution in the low- and high-risk score groups based on survival status. (C) Heatmap of the ARG expression profiles. (D) Overall survival curves stratified by the low- and high-risk group. (E) Time-dependent ROC curves for ARG-based overall survival prediction. (F) Univariate Cox regression analysis of signature and other clinical factors. (G) Multivariate Cox regression analysis of signature and other clinical factors.

