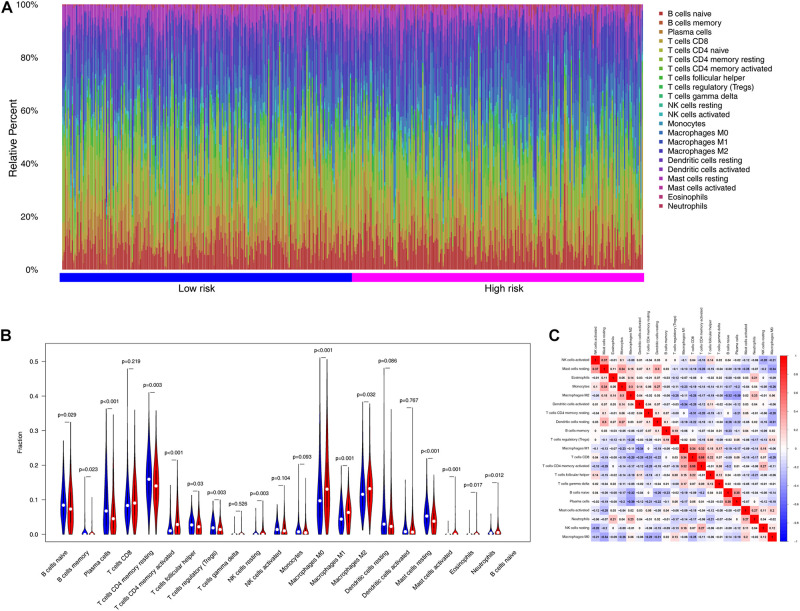
FIGURE 8.
The landscape of immune infiltration between high- and low-risk groups in the training set. (A) Immune cell type percentages in the low- and high-risk groups. (B) Differential immune infiltrates in the high-risk and low-risk groups. (C) Correlation matrix of the relationship between the expression levels of the six ARGs and differential immune infiltration levels.

