
FIGURE 5.
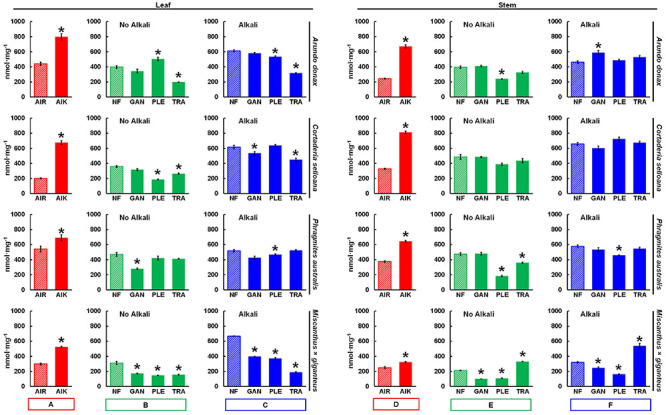
Saccharification of leaf and stem biomass from four poalean species measured by a high-throughput saccharification assay: Arundo donax, Cortaderia selloana, Phragmites australis and Miscanthus × giganteus. Mean nmol of reducing sugar released per mg of biomass material (nmol mg–1) after 8 h incubation in a hydrolytic enzyme mixture. Red bars (A,D) refer to non-pretreated alcohol insoluble residue samples, without (AIR) or with (AIK) a 0.1 M NaOH mild alkali pretreatment. Green bars (B,E) refer to samples treated only with one of the following white rot fungi (WRF): Ganoderma lucidum, GAN; Pleurotus ostreatus, PLE; Trametes versicolor, TRA. Blue bars (C,F) designate treatments where the 0.1 M NaOH treatment was employed subsequently to the WRF pretreatment. Pairwise t-tests were performed between each treatment and non-pretreated control samples (AIR; or NF, no fungi; striped bars) to evaluate the impact of the pretreatments. The treatments which are significantly different from the controls are marked with a “*” (p ≤ 0.05). Error bars represent the standard error of the sample replicates. For the saccharification values see Supplementary Table 1.