
Figure 6 .
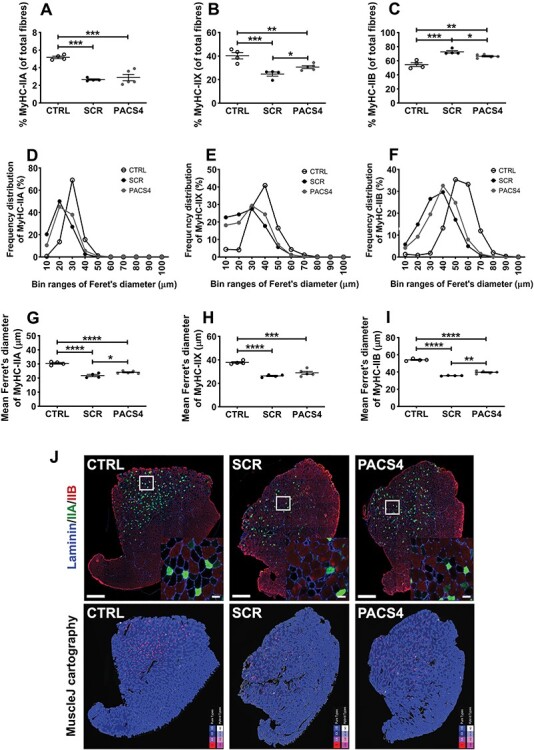
Vivo-PMO PACS4-mediated amelioration of muscle atrophy and myofiber type switching. Frozen TA muscle sections were immunostained for laminin (blue), MyHC IIA (green), MyHC IIB (red); unstained fibers were considered as MyHC IIX. The number of MyHC-positive fibers was automatically scored by MuscleJ and is expressed as the percentage of the total number of all myofibers within the entire muscle sections (A–C). Laminin staining was used for identifying the fiber sarcolemma and subsequent analysis of the minimal Feret’s diameter of myofibers. Histograms of frequency distribution (D–F) and the mean of the diameter of each myofiber type (G–I) are presented. Data are shown as mean ± SEM, n = 4–5. Statistical comparison was by one-way ANOVA and Tukey’s post hoc test (A–C, G–I); P < 0.05 (*), P < 0.01 (**), P < 0.001 (***), P < 0.0001 (****). Representative images of the entire TA muscle sections are shown at magnification of ×100, scale bar = 500 μm; enlarged images at higher magnification are shown in the subsets, scale bar = 50 μm. Corresponding cartographic images created by MuscleJ software are also displayed, with MyHC IIA, IIB and IIX fibers color-coded as purple, light blue and dark blue, respectively (J).