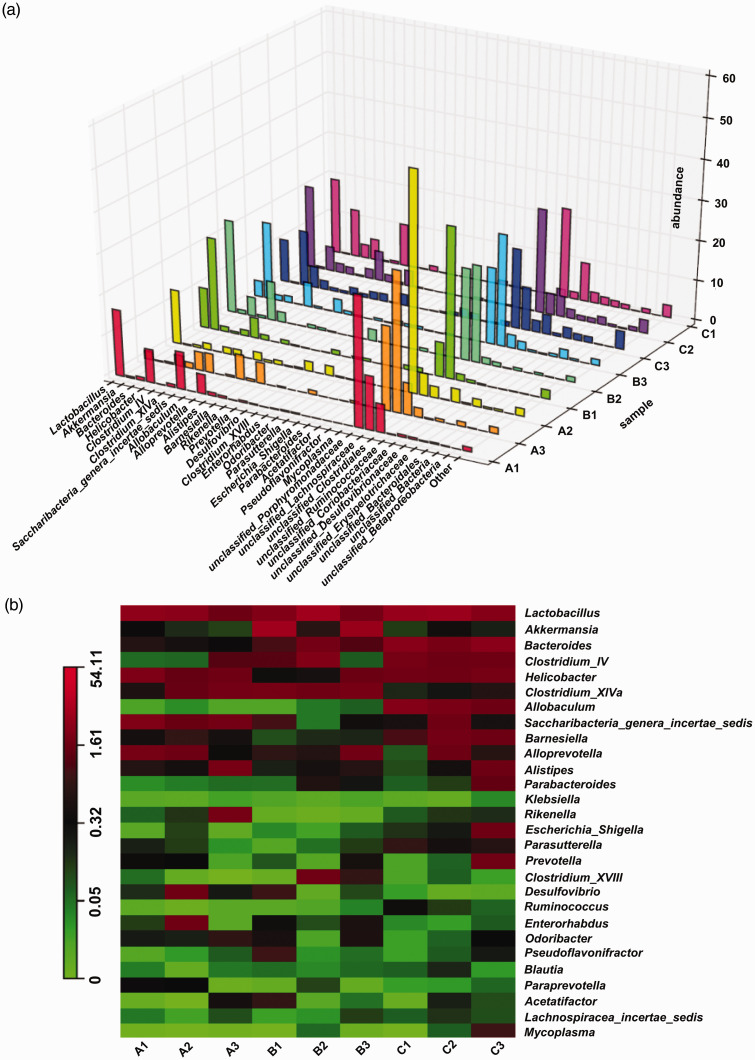
Figure 10.
Comparative analysis of intestinal microbiota of mice at the genus level. The relative abundances were determined by dividing each OTU read count by the total read count of the corresponding sample. (a) 3D histogram of relative abundance at the genus level, (b) heatmap of the community composition and abundance at the genus level. Note: A: control, B: UC, C: UC+FMT. Control: normal control, UC: ulcerative colitis model, UC+FMT: ulcerative colitis model + fecal microbiota transplantation. (A color version of this figure is available in the online journal.)
OTU: operational taxonomic unit; 3D: three-dimensional.

