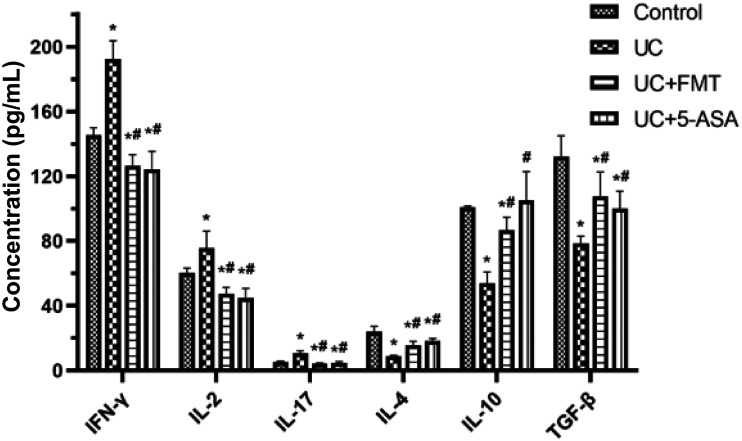
Figure 8.
Histogram of ELISA detection of serum levels of IFN-γ, IL-2, IL-17, IL-4, IL-10, and TGF-β in mice of each group. The standard wells were set up by adding 50 μL of standards at various concentrations to each well. Then, the blank and sample wells were set up. Each sample well was added 40 μL of sample diluent, followed by 10 μL of sample, and 100 μL of enzyme-labeled reagent. The microplate was covered with sealing film, and incubated for 60 min at 37°C. Color development was achieved after 15 min at 37°C in the dark. The OD values were determined at 450 nm. Note: All data were presented as mean ± standard deviation. Compared with control group, *P < 0.05; compared with UC group, #P < 0.05. Control: normal control, UC: ulcerative colitis model, UC+FMT: ulcerative colitis model + fecal microbiota transplantation, UC + 5-ASA: ulcerative colitis model + 5-aminosalicylic acid. ELISA: enzyme-linked immunosorbent assay; IFN-γ: interferon gamma; IL: interleukin; TGF-β: transforming growth factor beta.

