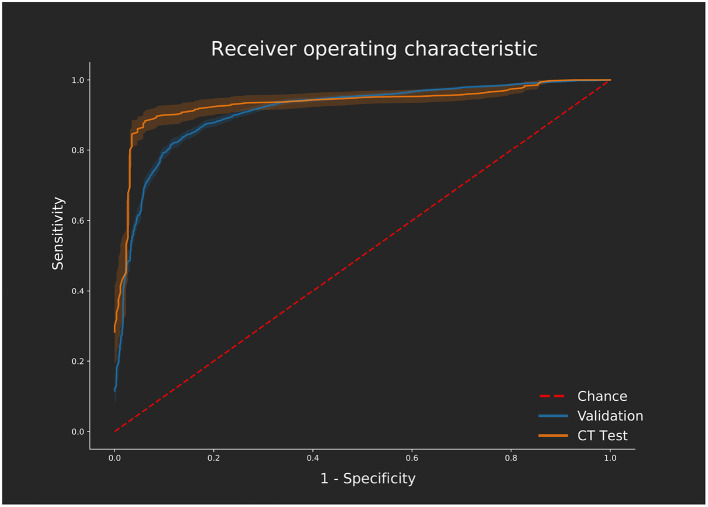
Figure 4.
ROC curves displaying the performance on the validation [magnetic resonance imaging (MRI) dataset] calculated across all 10 folds of cross validation using the optimum hyperparameter tuning. Performance of the independent computed tomography angiography (CTA) test set using the same network, trained with the MRI dataset only, is also shown. ROC curves were generated using the Scikit-learn (28) implementation varying the threshold required for a positive classification. Confidence is shown with 1 standard deviation from the mean sensitivity and specificity values shown for each curve as calculated using bootstrapping with replacement.

