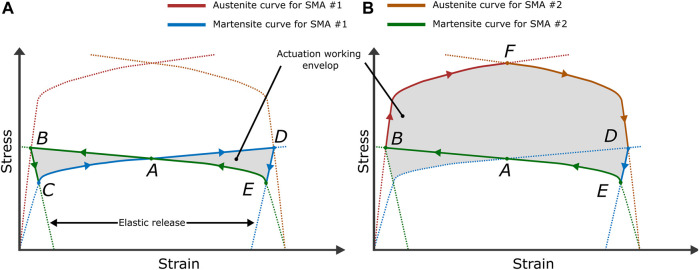
FIGURE 11.
Example of active biased SMA performance tests: (A): motion range tests, the (B–D) presents the maximum of motion range. (B): maximum output stress tests, the F presents the maximum output stress of system at certain temperature. The Panel is inspired by Georges et al. (2012).

