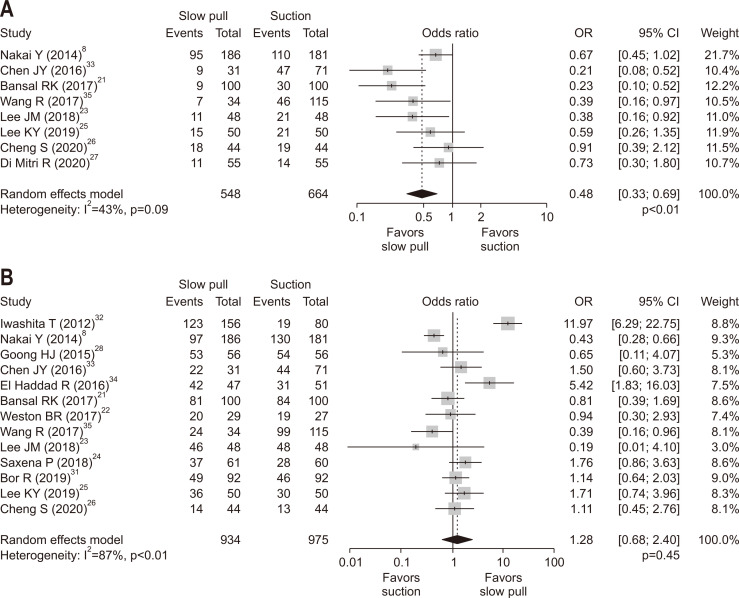
Fig. 4.
Comparison of specimen quality between slow pull and conventional suction techniques. (A) Blood contamination (overall). (B) Cellularity. The odds ratio (OR) (center of the gray square) for slow pull compared with conventional suction techniques is presented for each study along with its 95% confidence interval (CI; horizontal line). The summary OR based on the meta-analysis is presented at the bottom of each panel (black diamond) along with its 95% CI (upper and lower limits). The p-value for the Q-statistic for between-study heterogeneity is shown.

