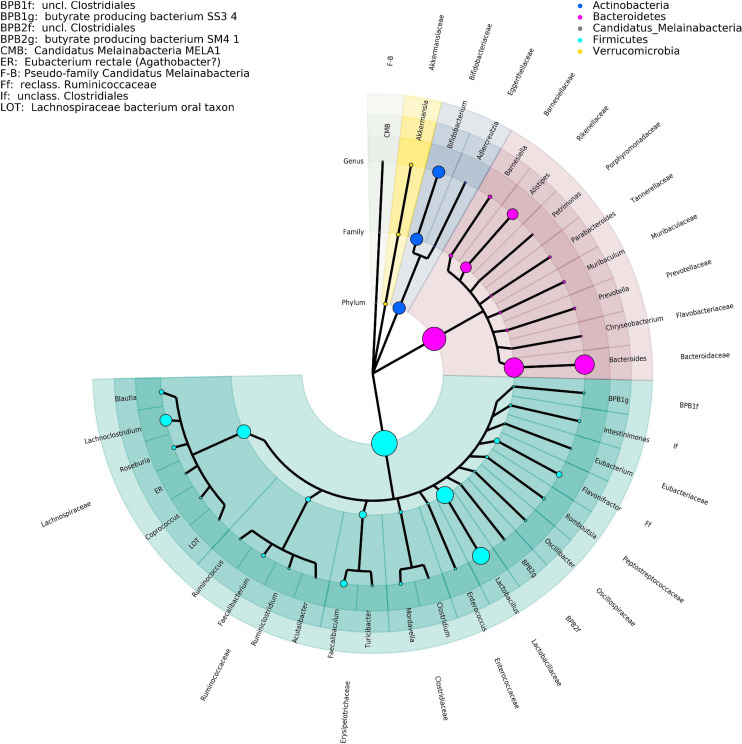
FIGURE 1.
Phylogenetic tree representing the major taxa appearing in the time-series analysis performed by DNA isolation method 1. Phylogeny data are taken from the NCBI taxonomy database, where only the taxonomic ranks of phylum, family, and genus are shown. The size of the clade markers is indicative of the average normalized read abundance for the taxon. Pseudofamilies and pseudogenera are used for organisms defined at a lower taxonomic level but lacking higher ranking categorization.

