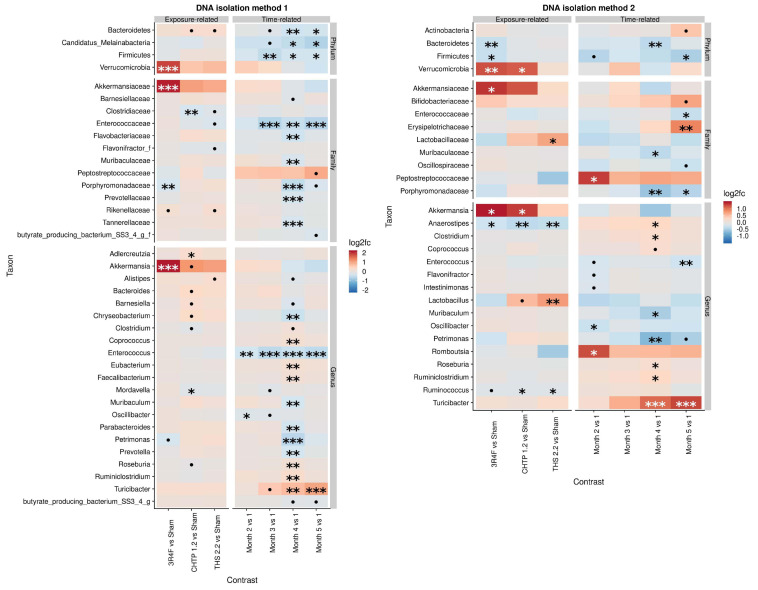
FIGURE 2.
Effects of 5-month continuous exposure on the fecal microbiome composition (excluding the switching groups) based on cage-wise sampling. Fold changes in the abundance of various microbial taxa (y-axis) are modeled as a function of exposure type relative to the sham group and time point relative to the first time point (month 1). Two methods of DNA isolation were used for different samples collected from the cages. Significance values are indicated as follows: ***p ≤ 0.001; **0.001 < p ≤ 0.01; *0.01 < p < 0.05; *0.05 < p < 0.1.

