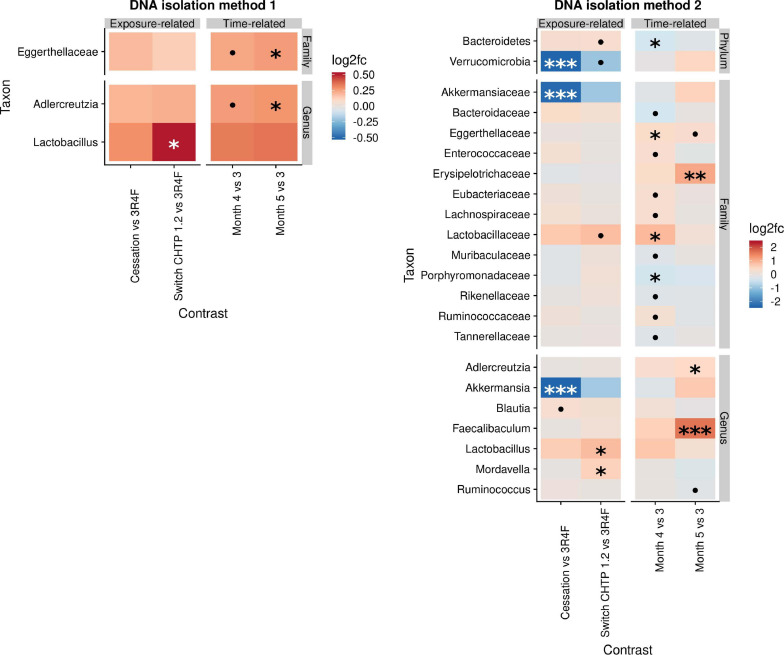
FIGURE 3.
Effects of cessation/switching to CHTP 1.2 relative to continued smoke exposure (lower). The intervention time point is at month 3. Fold-changes in the abundance of the various microbial taxa (y-axis) were modeled as a function of the exposure type relative to the CS exposure group, and the time point relative to the cessation/switching time point at month 3. Two methods of DNA isolation were used on different samples taken from the cages. Significance values are indicated as follows: ***p ≤ 0.001; **0.001 < p ≤ 0.01, *0.01 < p < 0.05; *0.05 < p < 0.1.

