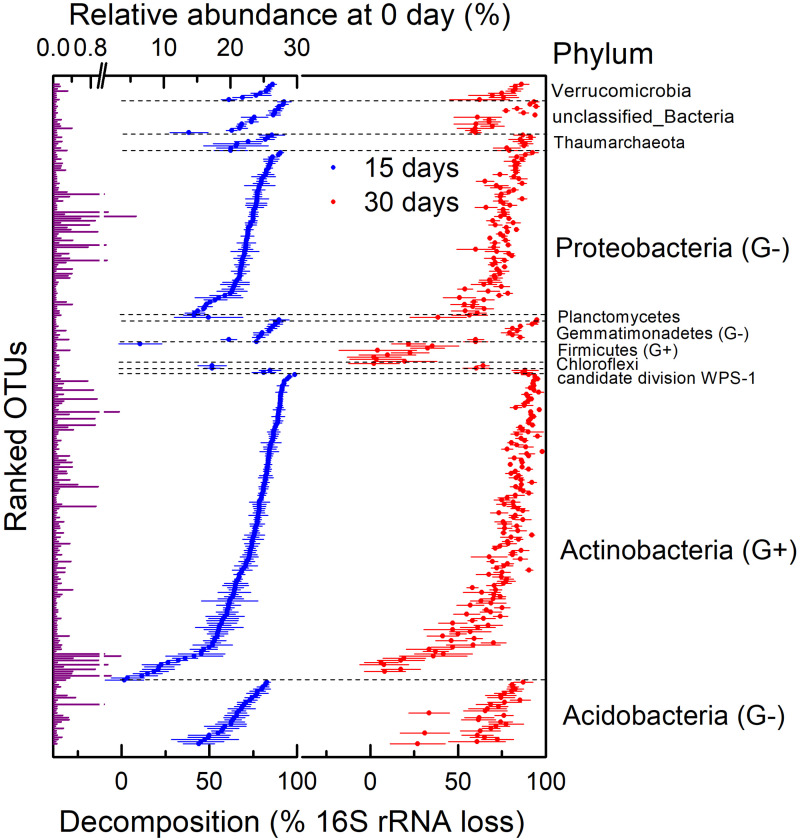
FIGURE 4.
Relative abundance on 0 day and decomposition of 16S rRNA gene at operational taxonomic unit (OTU) level in H218O light fraction (dead bacteria and archaea) at different times. This was assessed by calculating percentage of absolute abundance loss of 16S rRNA gene after 15 and 30 days. G+ in parentheses represents gram-positive bacteria, and G− in parentheses represents gram-negative bacteria. Points are average of four replicates, and bars show standard errors of means with four replicates.

