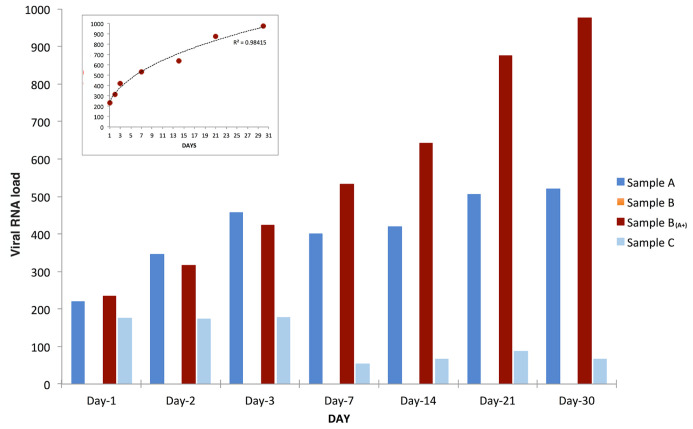
Figure 1. SARS-CoV-2 RNA load variation over time.
SARS-CoV-2 RNA load measurements (reported as AU, see extended data) of samples A (blue bars), B (orange bars), B (A+) (red bars), and C (azure bars) grown, all under the same conditions for thirty days from inoculation (day 0). SARS-CoV-2 RNA load in sample B (A+) had a power increase trend over time (as shown in the small frame on top-left), slightly increased in sample A, and decreased in sample C. As expected, sample B was found constantly negative.

