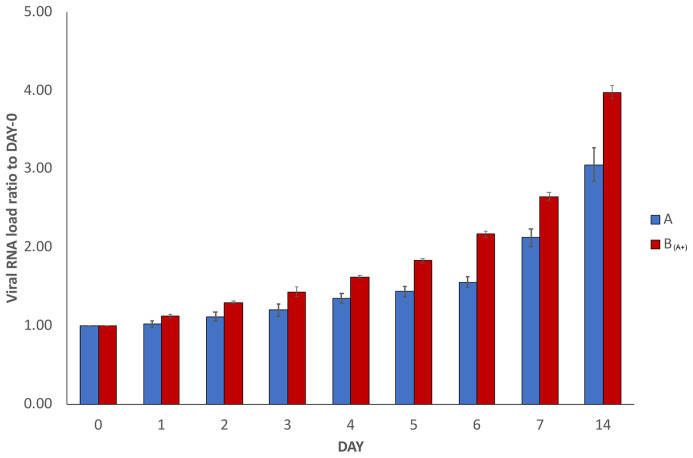
Figure 2. Average SARS-CoV-2 RNA load variation in repetitions.
The graph reports average results of three repetitions of the experiment conducted using the same starting material as described in Figure 1 (with the exception that the repetitions were stopped at day 14 instead of day 30). To normalise the measurements, all values at day 0 were used as denominator (at day 0 all values = 1), i.e. for each sample, at day X, the ratio between LuminexCountAtDayX/LuminexCountAtDay0 was calculated. Each bar represents the average of the SARS-CoV-2 RNA load ratio of samples A (blue bars) and B (A+) (red bars), together with the calculated standard deviations.

