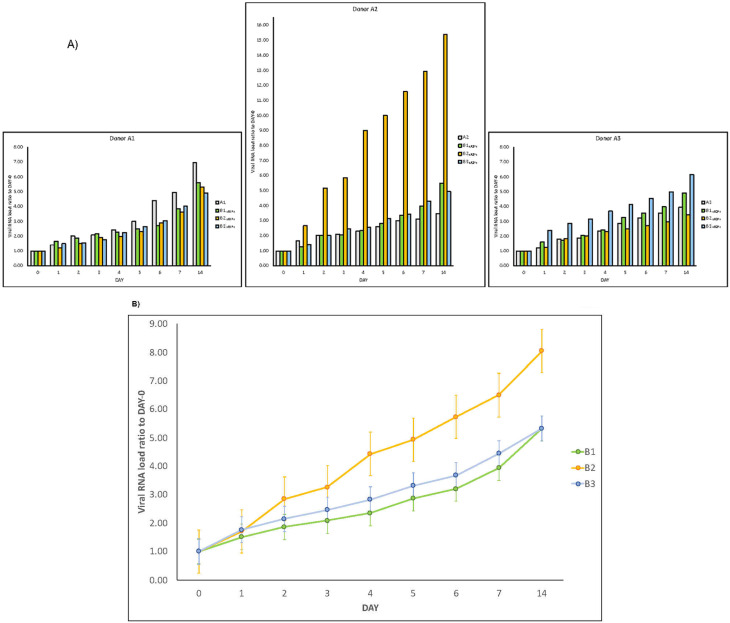
Figure 3. SARS-CoV-2 RNA load increase in different donor and recipient samples.
Results of experiments combining samples from three “infected donor” sources (A1, A2 and A3) and from three “healthy recipient” sources (B1, B2 and B3). A) The graphs report results of nine combinations. To normalise the measurements, all values at day 0 were used as denominator (at day 0 all values = 1), i.e. for each sample, at day X, the ratio between LuminexCountAtDayX/LuminexCountAtDay0 was calculated. Each bar represents the SARS-CoV-2 RNA load ratio. Although with certain differences, the observed trends are similar, confirming the increase over time of SARS-CoV-2 RNA load in samples of type A and samples of type B (A+), independently from the sources of A and B. B) Each line represents the average of the SARS-CoV-2 RNA load ratio of samples B1 (green line), B2 (yellow line), and B3 (azure line) infected each one with three different A donor sources. To normalise the measurements, all values at day 0 were normalised as described in panel A).

