
Figure 2.
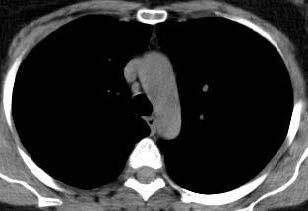
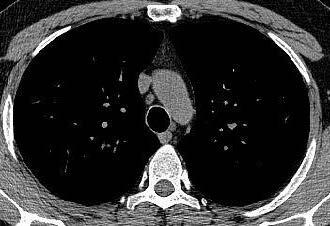
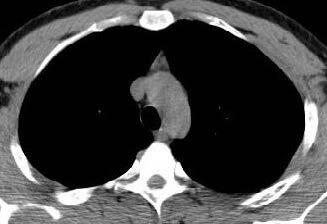
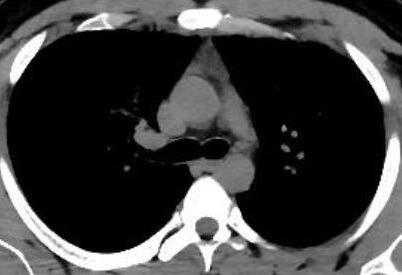
Axial thorax CT images in which the degree of thymus atenuation is assessed. Grade 3. Complete fatty degeneration of the thymus. b. Axial thorax CT images in which the degree of thymus atenuation is assessed. Grade 2. Thymus gland is mostly fatty and reticulonodular densities are observed. c. Axial thorax CT images in which the degree of thymus atenuation is assessed. Grade 1. The thymus is triangular in shape and consists of half solid and half fatty tissue. d. Axial thorax CT images in which the degree of thymus atenuation is assessed. Grade 0. Solid thymus tissue consisting of the majority soft tissue.