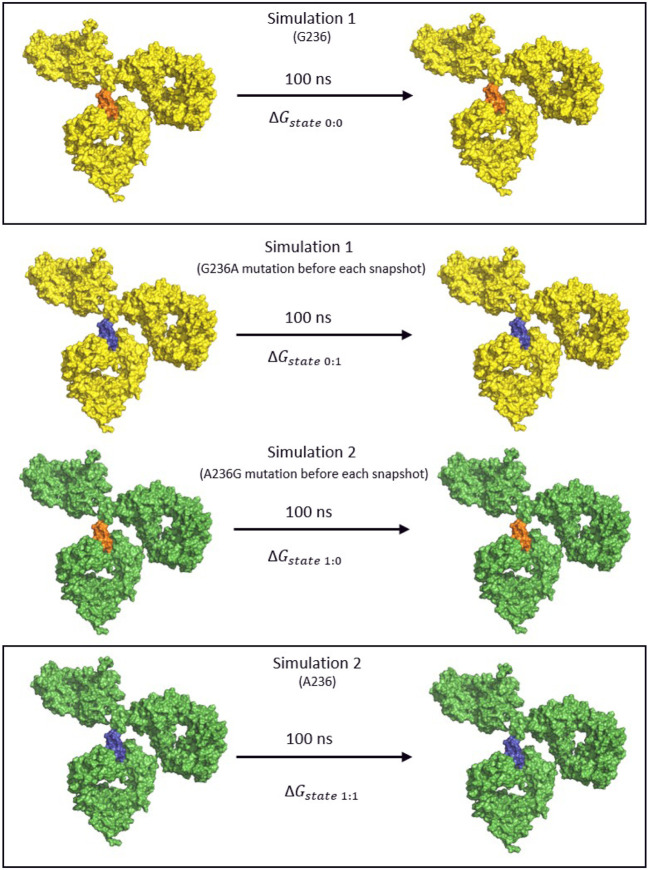
FIGURE 4.
The thermodynamic cycle for the calculation of the binding free energy using the BAR method. The IgG1 antibody is colored yellow for the first simulation and green for the second, the Gly236 variant is orange and the mutated Ala236 is blue. Two simulations were performed for each of the FcγR bound to the antibody. Subsequently, the intermediate trajectories 0→1 and 1→0 were obtained by mutating the original amino acid of the given simulation at every snapshot of the simulation before calculating the free energy terms.

