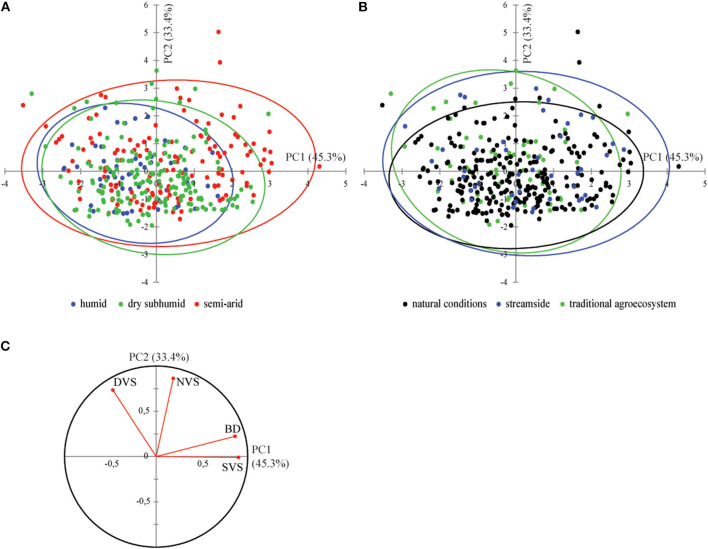
Figure 3.
Principal component analysis biplot of axes 1 and 2 (78.7% of variability) of wood olive samples belonging to different categories [(A) bioclimatic conditions and (B) growing conditions]. Correlations among anatomical traits [(C) correlation circle] and contribution of variables in the definition of PCA axes (C) are also presented.

