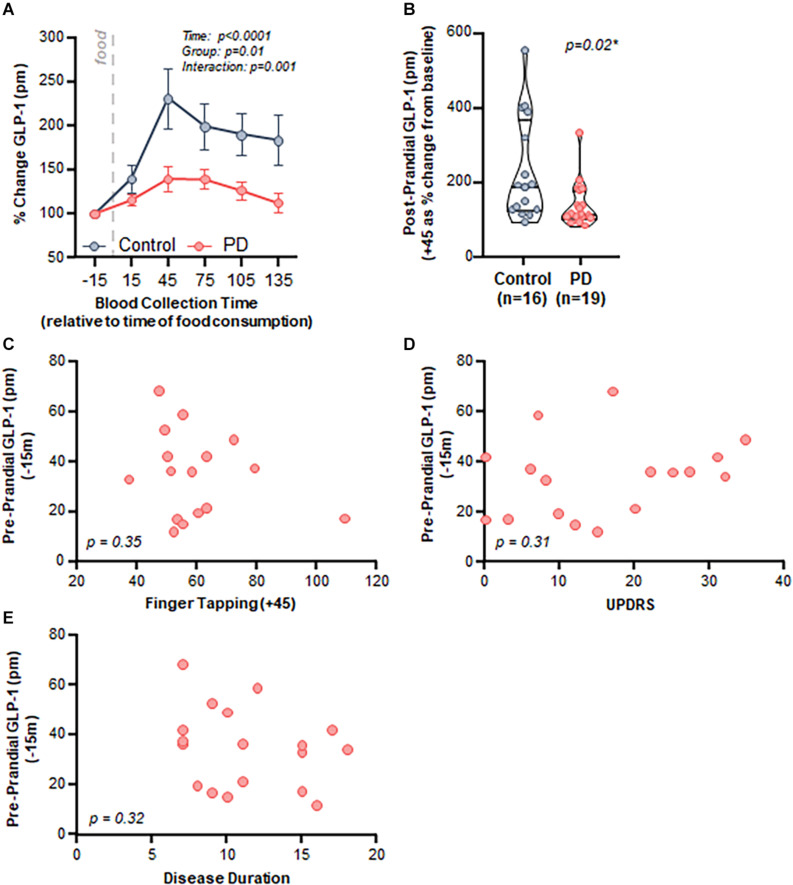
FIGURE 3.
PD patients demonstrated a diminished postprandial GLP-1 response compared to healthy matched control subjects, but there was no relationship with clinical characteristics. (A) Time course analysis of GLP-1 revealed a significant effect of time (p < 0.0001, F(2.032,59.74) = 15.95), group (Control vs. PD, p = 0.01 F(1,33) = 6.90), as well as an interaction (p = 0.001 F(5,147) = 4.34). Area under the curve: control = 27,049 ± 4,548, PD = 18,818 ± 2,049, (B) Peak postprandial GLP-1 levels were significantly lower in PD subjects compared to controls (p = 0.02). There was no relationship between GLP-1 and clinical characteristics including: (C) finger tapping (p = 0.35, r = –0.25, r2 = 0.06), (D) MDS-UPDRS (p = 0.31, r = 0.26, r2 = 0.07), and (E) disease duration (p = 0.32, r = –0.25, r2 = 0.06).

