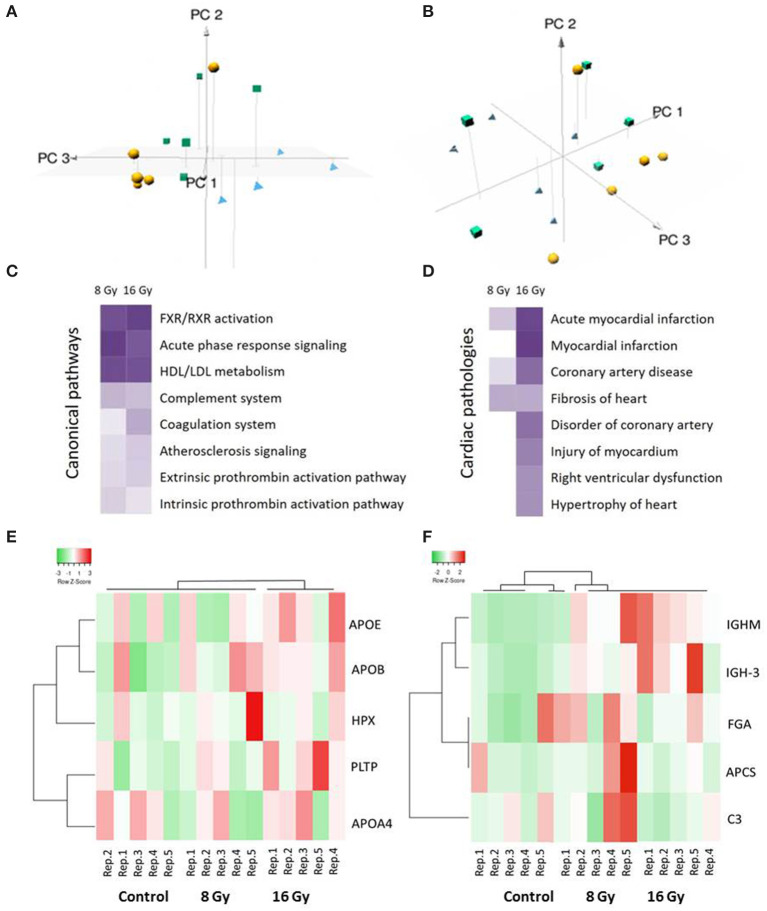
Figure 1.
Multivariate, pathway, and cardiotoxicity analyses of the significantly differentially expressed serum proteins after local heart irradiation using 0 (control), 8, or 16 Gy. The principal component analysis (PCA) performed on normalized intensities of all proteins resulted in PC1, PC2, and PC3 as follows: PC1 15.9%, PC2 15.1%, and PC3 12.3%. The control samples are represented as yellow balls, the samples exposed to 8 Gy in green cubes, and the 16 Gy treated samples in blue pyramids (A,B). A dose-dependent alteration is observed in the pathways involved in the inflammation and lipid metabolism (C). Several proteins were identified associated with different heart pathologies (D). The pathway and cardiotoxicity scores are displayed using a purple color gradient; the darker the color, the higher the scores and, thereby, statistical significance. The score is the negative log of the p-value derived from the Fisher's Exact test. By default, the rows (pathways) with the highest total scores across the set of observations are sorted to the top. The analysis was performed using Ingenuity Pathway Analysis (IPA) (Qiagen Inc., https://www.qiagenbioinformatics.com/products/ingenuity-pathway-analysis). The heat maps show hierarchical clustering (complete linkage, Spearman ranked correlation) of significantly deregulated proteins belonging to the high-density lipoprotein (HDL)/low-density lipoprotein (LDL) metabolism (E) and acute phase response (F) pathways in the control and irradiated samples. The green bars indicate downregulation and the red bars upregulation. The analysis was performed by the Heatmapper web server (http://www.heatmapper.ca/) (31). Detailed information of the proteomics features and individual samples is given in Supplementary Table 1.

