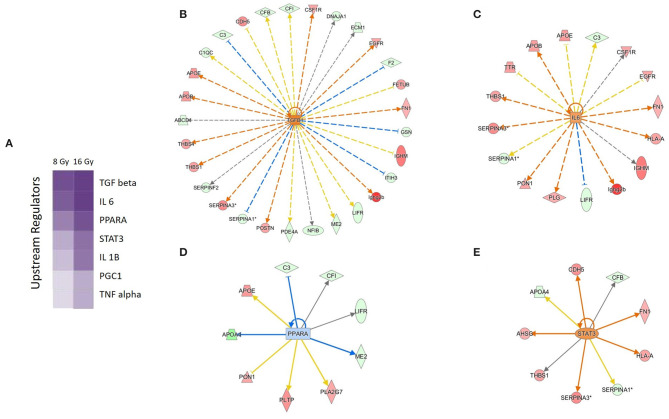
Figure 3.
Predicted upstream regulators of the deregulated serum proteins. Predicted upstream regulators are displayed using a purple color gradient where the intensity of the purple color corresponds to statistical significance (the deeper the color, the higher the significance). The score is the negative log of the p-value derived from Fisher's exact test. By default, the rows (upstream regulators) with the highest total scores across the set of observations are sorted to the top (A). The predicted upstream regulators and their activity status at 16 Gy are shown: TGF-β (B), IL-6 (C), PPARα (D), and STAT3 (E). The orange and the blue color of the nodes indicate activation and deactivation, respectively; the solid arrows represent direct interactions and the dotted arrows indirect interactions. The deregulated proteins forming the wheel around the nodes are marked in red (upregulation) and green (downregulation). The IPA codes and corresponding full protein names are shown in Table 1 and in Supplementary Table 1. The analysis was performed using Ingenuity Pathway Analysis (IPA) (https://www.qiagenbioinformatics.com/products/ingenuity-pathway-analysis).

