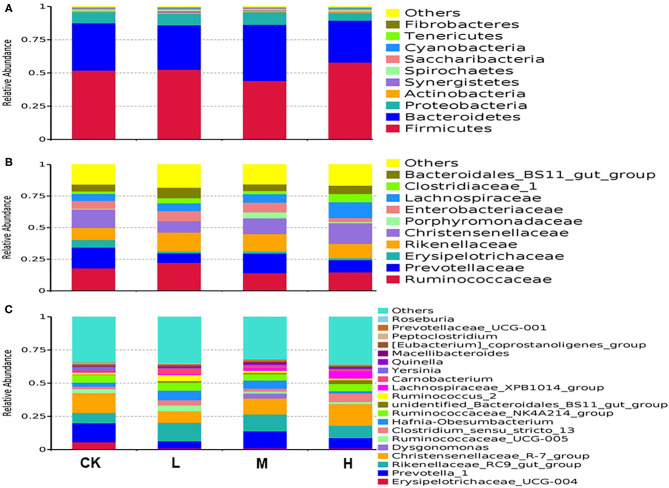
Figure 1.
Relative abundance of operational taxonomic units agglomerated of bacterial taxa averaged under phylum level for (A), family level for (B), and genera level for (C) at the four SeY doses (mg SeY/kg dry matter) (CK, 0; L, 0.09; M, 0.18; H, 0.36). The color-coded bar plot shows the average bacterial phylum, family, and genus distributions level of the nutritional diets sampled. CK, control; L, low Se, M, medium Se; H, high Se.

