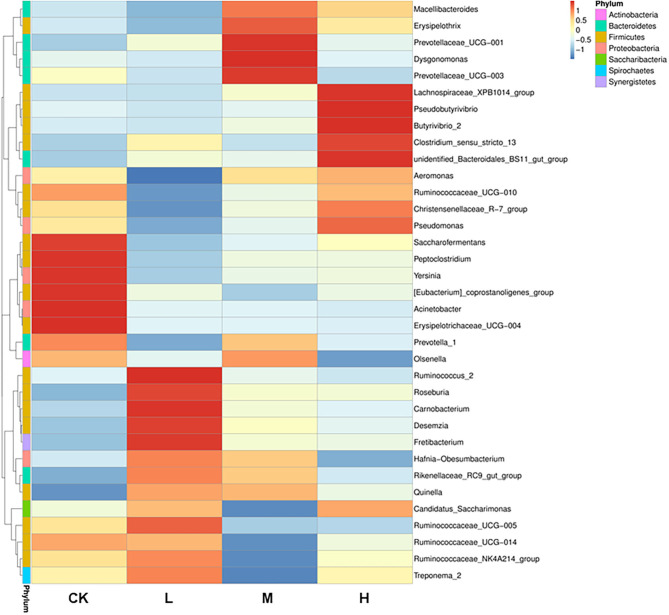
Figure 2.
Heatmap analysis of 35 shared prokaryotic community genera of all Tibetan sheep, as determined by the relative abundance of each shared genera through sequencing platform. The vertical direction is the sample information, and the horizontal direction is the species annotation information. The left cluster tree is the species clustering tree; the middle heatmap corresponds to the value of each row of the relative abundance of species after the standardized treatment of the Z-score.

