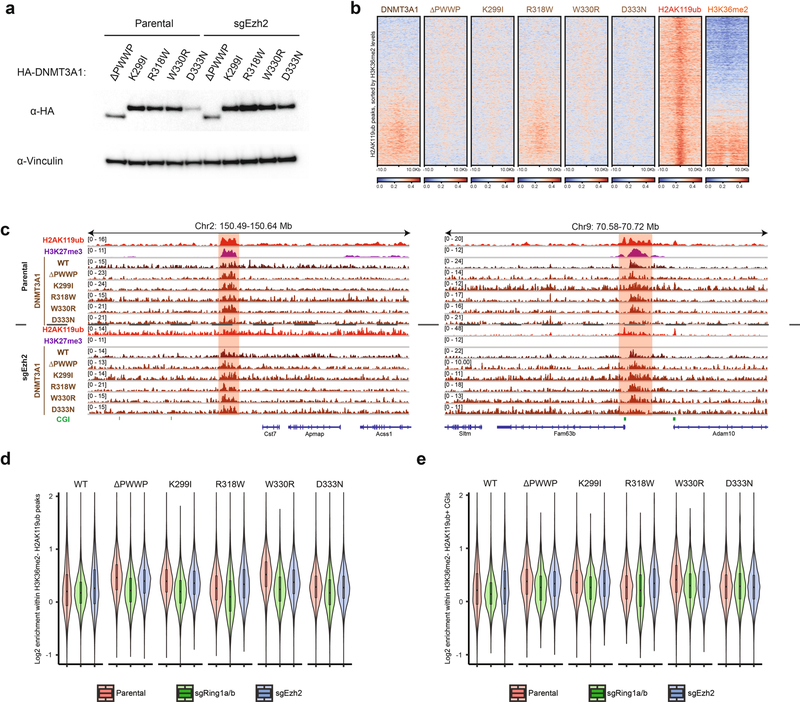
Extended Data Fig. 7 |. DNMT3A recruitment to H2AK119ub-enriched regions remains intact upon genetic ablation of PRC2.
a) Immunoblots of lysates generated from parental and sgEzh2 mouse MSCs that ectopically express HA-tagged DNMT3A1 PWWP mutants. Vinculin was used as a loading control. Data are representative of two independent experiments. b) Enrichment heat map depicting ChIP-seq normalized reads centered at H2AK119ub peaks ± 10-kb (n = 16,064) for DNMT3A1 wild-type, DNMT3A1 PWWP mutants, H2AK119ub, and H3K36me2 in sgEzh2 mouse MSCs. Regions are sorted by increasing H3K36me2 enrichment. c) Genome browser representation of ChIP-seq normalized reads for H2AK119ub, H3K27me3, DNMT3A1 wild-type and DNMT3A1 PWWP mutants in parental and sgEzh2 mouse MSCs at chromosome 2: 150.49–150.64Mb and chromosome 9: 70.58–70.72 Mb. CGIs (green) and genes from the RefSeq database are annotated at the bottom. The shaded areas indicate genomic regions enriched for both H2AK119ub and H3K27me3. d) Violin plots for ChIP-seq normalized reads across 10-kb bins overlapping parental H3K36me2-depleted H2AK119ub peak regions (n = 16,436) of DNMT3A1 wild-type and PWWP mutants in parental (red), sgRing1a/b (green), and sgEzh2 (blue) mouse MSCs. The center line in the embedded boxplots represents the median, the box limits are the 25th and 75th percentiles, and the whiskers are the minimum to maximum values. Outliers beyond 1.5 times the value of the 25th and 75th percentile across all bins are excluded (n = 269 excluded). e) Violin plots for ChIP-seq normalized reads across 10-kb bins overlapping parental H3K36me2-depleted H2AK119ub-enriched CGIs (n = 4,621) of DNMT3A1 wild-type and PWWP mutants in parental (red), sgRing1a/b (green), and sgEzh2 (blue) mouse MSCs. The center line in the embedded boxplots represents the median, the box limits are the 25th and 75th percentiles, and the whiskers are the minimum to maximum values. Outliers beyond 1.5 times the value of the 25th and 75th percentile across all bins are excluded (n = 87 excluded).

