Extended Data Fig. 9 |.
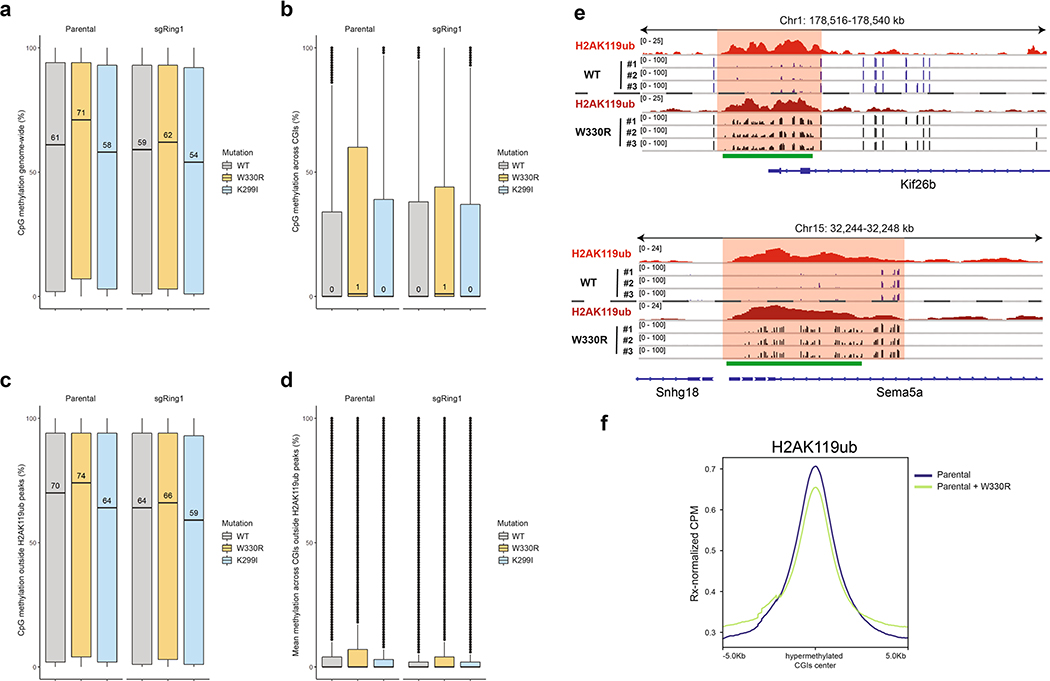
DNA methylation landscape changes associated with alterations in DNMT3A recruitment a) Boxplots for CpG methylation genome-wide (n = 2,115,198 CpGs) in parental and sgRing1a/b mouse MSCs expressing DNMT3A1 wild-type (gray), K299I (blue), or W330R (orange). The center line represents the median (indicated), the box limits are the 25th and 75th percentiles, the whiskers are the minimum to maximum values and discrete points represent outliers. b) Boxplots for CpG methylation at CpG islands (n = 718,611 CpGs) in parental and sgRing1a/b mouse MSCs expressing DNMT3A1 wild-type (gray), K299I (blue), or W330R (orange). The center line represents the median (indicated), the box limits are the 25th and 75th percentiles, the whiskers are the minimum to maximum values and discrete points represent outliers. c) Boxplots for CpG methylation outside parental H2AK119ub peak regions (n = 1,727,890 CpGs) in parental and sgRing1a/b mouse MSCs expressing DNMT3A1 wild-type (gray), K299I (blue), or W330R (orange). The center line represents the median (indicated), the box limits are the 25th and 75th percentiles, the whiskers are the minimum to maximum values and discrete points represent outliers. d) Boxplots for CpG methylation at CpG islands outside parental H2AK119ub peak regions (n = 442,516 CpGs) in parental and sgRing1a/b mouse MSCs expressing DNMT3A1 wild-type (gray), K299I (blue), or W330R (orange). The center line represents the median (indicated), the box limits are the 25th and 75th percentiles, the whiskers are the minimum to maximum values and discrete points represent outliers. e) Genome browser representation of ChIP-seq normalized reads for H2AK119ub and Reduced Representation Bisulfite Sequencing (RRBS) data for CpG methylation (black) in parental mouse MSCs expressing either wild-type or W330R DNMT3A1 at chromosome 1: 178,516–178,540 Kb and chromosome 15: 32,244–32,248 Kb. CGIs (green) and genes from the RefSeq database are annotated at the bottom. f) Averaged ChIP-seq Rx-normalized read signal at hypermethylated CpG islands in DNMT3A1 W330R-expressing cells ± 5-kb (n = 3,054, methylation difference >20%, FDR = 0.01), represented as Rx-adjusted CPM for H2AK119ub in parental mouse MSCs compared to cells expressing DNMT3A1 W330R.

