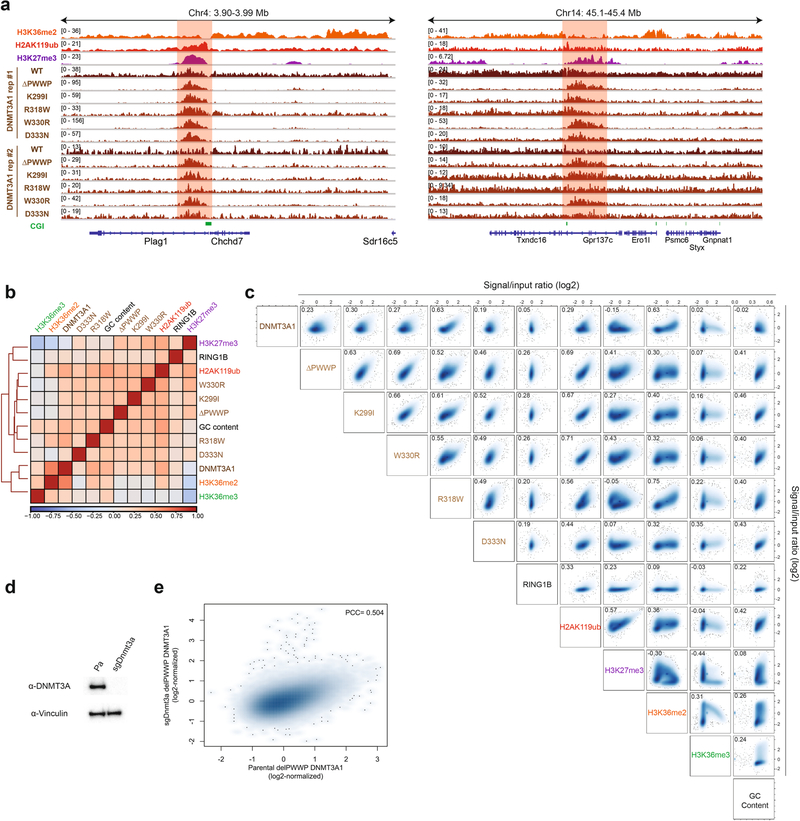
Extended Data Fig. 1 |. Profiling DNMT3A PWWP mutant genomic targeting genome-wide.
a) Genome browser representation of ChIP-seq normalized reads for H3K36me2, H2AK119ub, H3K27me3, and replicates of DNMT3A1 wild-type and DNMT3A1 PWWP mutants in mouse MSCs at chromosome 4: 3.90–3.99 Mb and chromosome 14: 45.1–45.4 Mb. CGIs (green) and genes from the RefSeq database are annotated at the bottom. The shaded areas indicate H2AK119ub-enriched genomic regions. b) Heat map showing genome-wide, pairwise Pearson correlations across 10-kb bins (n = 245,842) between H3K36me2, H3K36me3, H3K27me3, GC content, and RING1B with replicates of H2AK119ub, DNMT3A1 wild-type, and DNMT3A1 PWWP mutants. c) Scatterplots showing genome-wide, pairwise Pearson correlations across 10-kb bins (n = 245,842) for ChIP-seq normalized reads between H3K36me2, H3K36me3, H3K27me3, H2AK119ub, GC content, DNMT3A1 wild-type, DNMT3A1 PWWP mutants, and RING1B. Pearson’s correlation coefficients are indicated. d) Immunoblots of lysates generated from parental and sgDnmt3a mouse MSCs. Vinculin was used as a loading control. Data are representative of two independent experiments. e) Scatterplot showing genome-wide Pearson correlation across 10-kb bins (n = 245,842) for ChIP-seq normalized reads of DNMT3A1 ΔPWWP between parental and sgDnmt3a cells. Pearson’s correlation coefficient is indicated.

