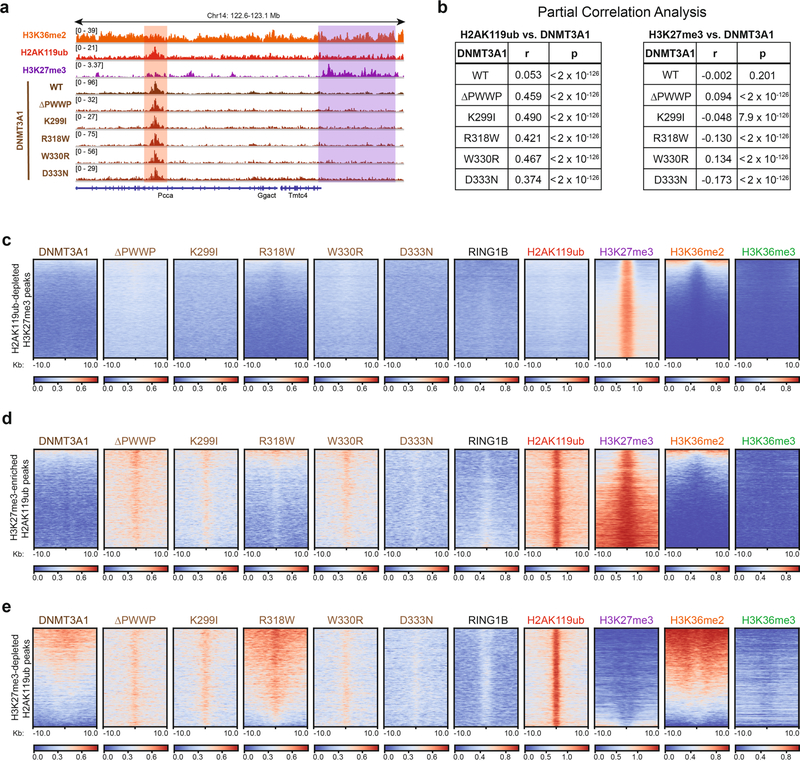
Extended Data Fig. 3 |. DNMT3A mutants colocalize with H2AK119ub independently of H3K27me3.
a) Genome browser representation of ChIP-seq normalized reads for H2AK119ub, H3K27me3, DNMT3A1 wild-type and DNMT3A1 PWWP mutants in mouse MSCs at chromosome 14: 122.6–123.1 Mb. Genes from the RefSeq database are annotated at the bottom. The shaded areas indicate H3K27me3-enriched (purple) and H2AK119ub-enriched (red) genomic regions. b) Genome-wide partial correlations of ChIP-seq normalized reads across 10-kb bins (n = 245,842) in parental MSCs. Left: relationships between DNMT3A1 PWWP mutants and H2AK119ub after controlling for H3K27me3 and H3K36me2. Right: relationships between DNMT3A1 PWWP mutants and H3K27me3 after controlling for H2AK119ub and H3K36me2. P values of partial correlations were determined using a Student’s t distribution42. c) Enrichment heat map depicting ChIP-seq normalized reads centered at H2AK119ub-depleted H3K27me3 peaks ± 10-kb (n = 34,361) for DNMT3A1 wild-type, DNMT3A1 PWWP mutants, RING1B, H2AK119ub, H3K27me3, H3K36me2, and H3K36me3. Regions are sorted by H3K36me2 enrichment. d) Enrichment heat map depicting ChIP-seq normalized reads centered at H3K27me3-enriched H2AK119ub peaks ± 10-kb (n = 9,868) for DNMT3A1 wild-type, DNMT3A1 PWWP mutants, RING1B, H2AK119ub, H3K27me3, H3K36me2, and H3K36me3. Regions are sorted by H3K36me2 enrichment. e) Enrichment heat map depicting ChIP-seq normalized reads centered at H3K27me3-depleted H2AK119ub peaks ± 10-kb (n = 6,837) for DNMT3A1 wild-type, DNMT3A1 PWWP mutants, RING1B, H2AK119ub, H3K27me3, H3K36me2, and H3K36me3. Regions are sorted by H3K36me2 enrichment.

