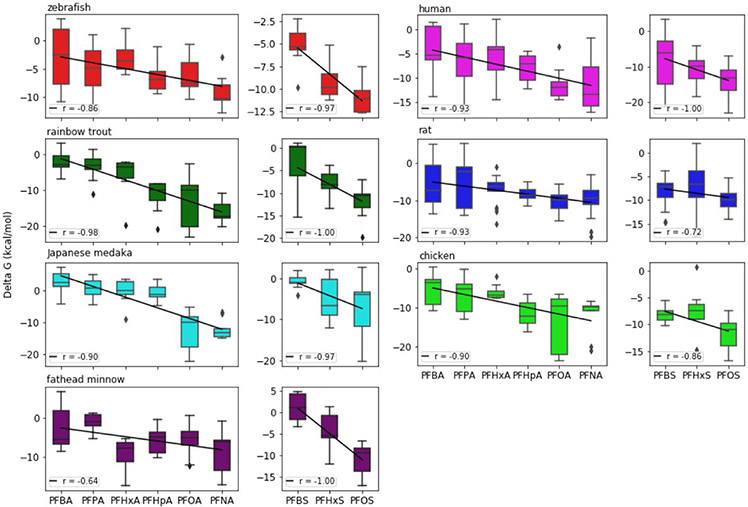
Figure 6.
Distribution of ΔGbind for different PFAS-LFABP complexes across species. The correlation coefficient between the mean of ΔGbind and PFAS chain length ranges between −0.64 and −1.00, indicating that binding affinity increases with chain length (a more negative ΔGbind means stronger affinity, and is exponentially related to the dissociation constant, KD).

