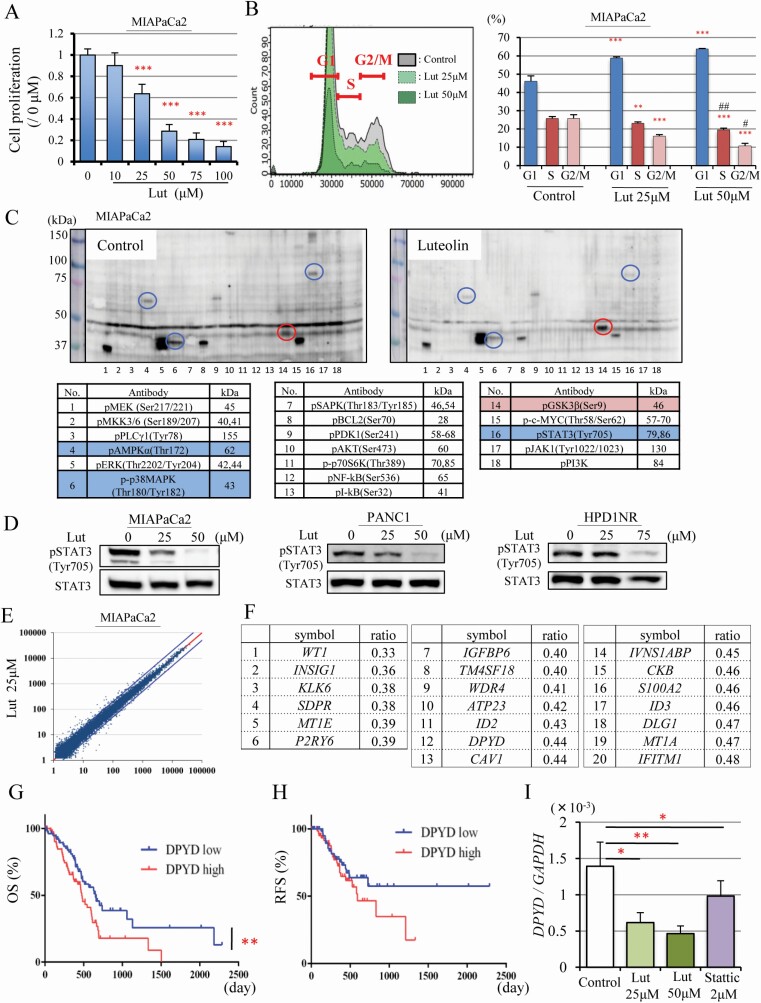
Figure 2.
Luteolin suppresses pSTAT3 and DPYD expression. Cell proliferation quantified by WST-1 assay (n = 6 per dose) (A), and cell cycle analysis (n = 3 per dose) of MIAPaCa2 cells after Luteolin (Lut) treatment for 48 h (B). Multi-Western blotting of phosphorylated proteins associated with cell proliferation. On the left, no treatment and on the right 75 μM Lut treatment for 48 h. Circles and labels in blue or red depict Lut down- or up-regulated proteins in MIAPaCa2 cells, respectively (C). Western blotting for pSTAT3 (Tyr705), STAT3 after Lut (25, 50μM) treatment for 48 h in MIAPaCa2, PANC1, HPD1NR (D). Relative mRNA expression plotted from the result of microarrays comparing no treatment with 25 μM Lut treatment for 48 h in MIAPaCa2 cells. Blue lines are ratios of mRNA expression in controls: 25 μM Lut = 1 : 2 or 2 : 1 (E). The 20 genes most down-regulated by 25 μM Lut treatment (relative expression >100 in controls) were detected by microarray analysis (F). Overall survival (OS) (Log-rank test **P < 0.01) (G) and recurrence-free survival (RFS) (H) of PDAC patients extracted from the TCGA pancreatic cancer dataset (n = 159), which includes DPYD high expression (n = 79) and DPYD low expression (n = 80). Expression of DPYD mRNA after Lut (25, 50 μM) and Stattic (2 μM) treatment in MIAPaCa2 cells (I). Data are mean ± SD. *, **, *** P < 0.05, 0.01, 0.001 compared with no treatment. #, ##P < 0.05, 0.01 between 25 μM and 50 μM Lut treatment.

