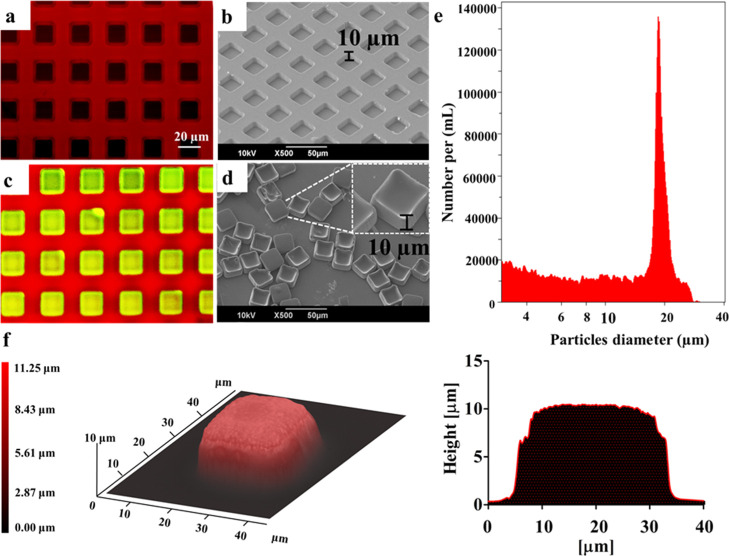
Figure 1.
Geometrical characterization of μPLs. (a) Confocal microscopy and (b) SEM image of an empty PVA template; (c) confocal microscopy image of a PVA template (red) filled with a PLGA/CURC paste forming CURC-μPLs (green/yellow); (d) SEM image of individual μPLs released from the PVA template. The lateral inset shows a magnified and tilted view of the μPLs; (e) size distribution profile for μPLs via a Multisizer Coulter Counter analysis; (f) optical-profilometer topographic image of a μPL, where the red-level false coloring correlates with the local particle thickness. The plot on the right represents the cross-sectional profile of the μPL.

