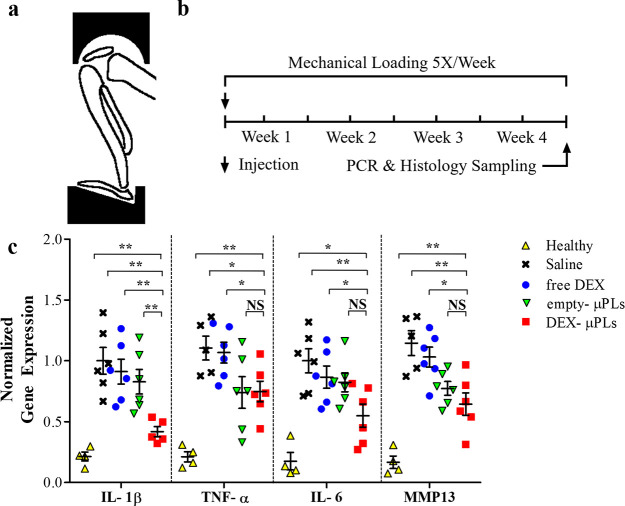
Figure 5.
Proinflammatory gene expression in a PTOA model mouse. (a) Schematic of the loading fixture used in the mechanical loading of mouse knee joints to induce PTOA; (b) mechanical loading regimen; (c) in vivo expression of IL-1β, TNF-α, IL-6, and MMP-13 measured by TaqMan qPCR (for each treatment groups n = 6, while for the healthy group n = 4). Statistical analysis via one-way ANOVA (GraphPad Prism 8), corrected for multiple comparisons by controlling the false discovery rate with a two-stage, step-up Benjamini–Krieger–Yekutieli method: *p < 0.05 and **p < 0.01, while no significant differences are indicated on the graphs as NS. A full list of p-values is provided in Table. S4.

