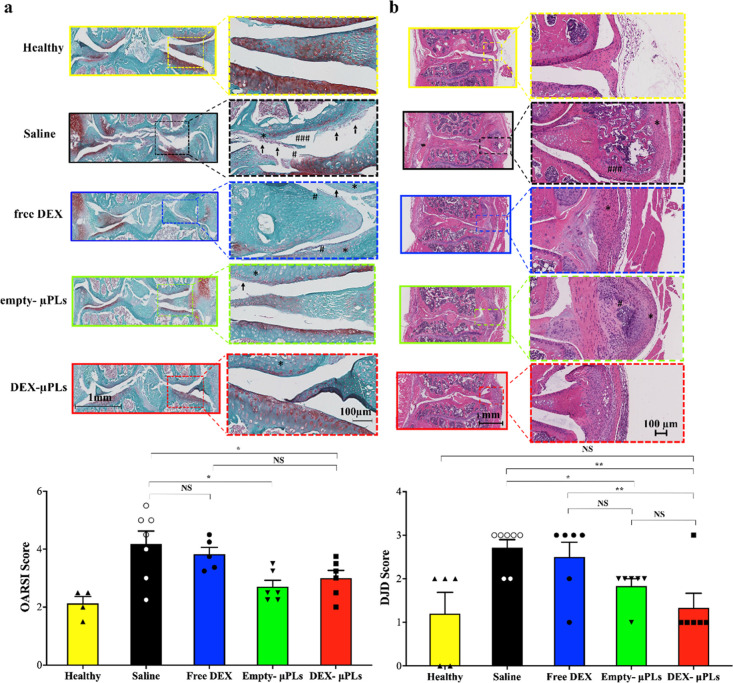
Figure 6.
Safranin-O staining of joint sections (OARSI scoring) and H&E staining of joint sections in a PTOA mouse model (DJD scoring). (a) Representative safranin-O staining of the articular surface of the tibia and femur; insets show areas of interest under increased magnification (top) and treatment-blinded histological scoring by OARSI standards (bottom) (for each treatment groups, n = 6, while for the healthy group, n = 4). (Histology: arrows—cartilage erosion, #—cartilage fissures, *—low safranin-O staining; plotted data: *p < 0.05, no significant differences are indicated on the graphs as NS). Statistical significance via one-way ANOVA (GraphPad Prism 8), corrected for multiple comparisons by controlling the false discovery rate with a two-stage, step-up Benjamini–Krieger–Yekutieli method; all images are matched in the scale; (b) H&E staining of PTOA joints showing a representative slide for each treatment group (histology: #—mineralization and *—cellular infiltration and synovial membrane thickening); insets show higher magnification images of synovial tissue (top) and DJD scoring of the joint histology by a treatment-blinded pathologist (bottom, *p < 0.05, while no significant differences are indicated on the graphs as NS); statistical significance via one-way ANOVA (GraphPad Prism 8), corrected for multiple comparisons by controlling the false discovery rate with a two-stage, step-up Benjamini–Krieger–Yekutieli method, statistically; all images are matched in the scale. In the lower magnification images, scale bar = 1 mm, while in higher magnification images, scale bar = 100 μm (for each treatment groups, n = 6, while for the healthy group, n = 4).

