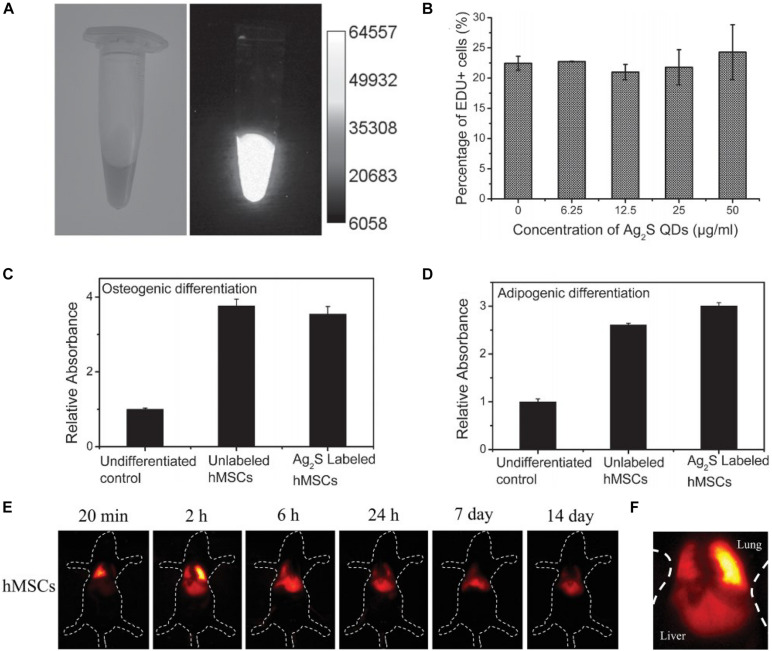
FIGURE 4.
(A) A photoluminescence image (PA) of the Ag2S QD-labeled human MSC solution at a density of 4 × 10⁶ cell ml–1. (B) Cell proliferation. Quantification of (C) osteogenic and (D) adipogenic differentiation by measuring the absorbance of Oil-Red O and alizarin red extracted from cell lysates at 404 nm, respectively. (E) The time course of the in vivo near-infrared (NIR) PL images of a healthy mouse after transplantation of Ag2S QD-labeled human MSCs. (F) Higher magnification NIR PL image of mice transplanted with human MSCs only after 2 h (adapted from Chen G. et al., 2015).

