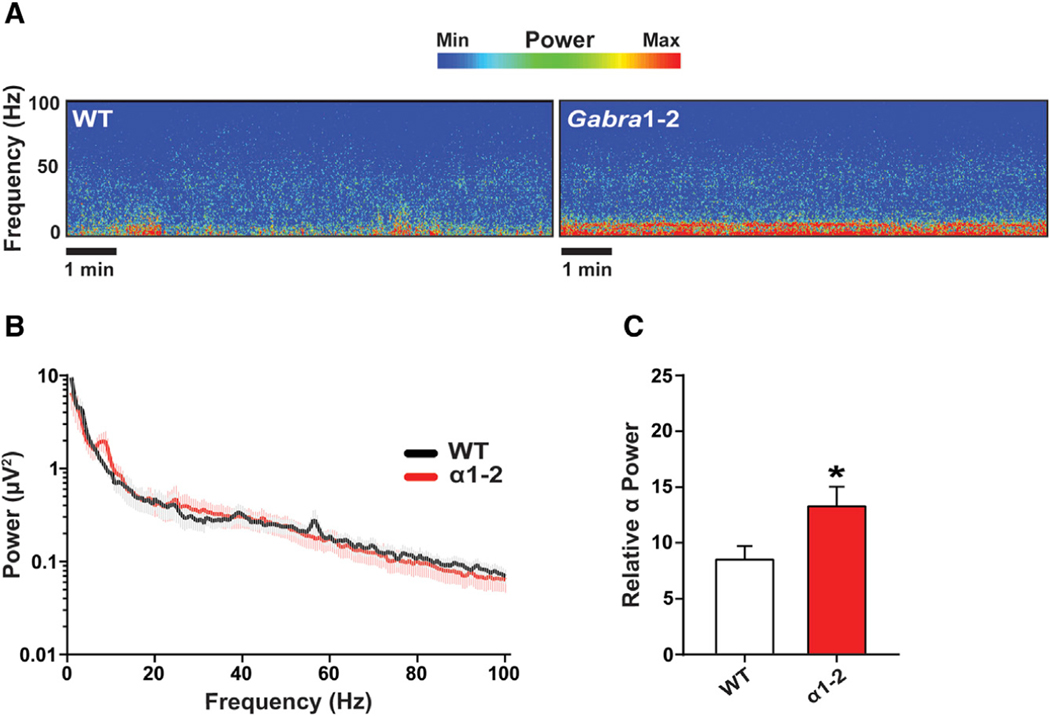
Figure 5. The Gabra1–2 Mutation Produces Baseline Abnormalities in Cortical Electroencephalographic (EEG) Recordings.
(A) Spectrograms of representative WT and Gabra1–2 (n = 9 mice/genotype in 3 cohorts) EEG recordings without pharmacological manipulation.
(B) Power spectral density (PSD) plot of 10 minutes of awake baseline EEG activity.
(C) Pooled quantification of the relative power of binned frequency bands revealed a significant increase in the relative power of the α band (8–13 Hz) in Gabra1–2 mutants compared with WT littermate controls. Data were analyzed using unpaired t tests (*p < 0.05). Error bars represent mean ± SEM.
(E and F) The relative (E) and cumulative (F) frequency of mIPSC events of different amplitudes.
(G and H) Fitting the data to Gaussian curves and creating mIPSC histograms for WT (G) and Gabra1–2 (H) demonstrates the existence of a fourth, higher amplitude (Peak 4, blue, mean = —80.7 pA) curve in mutants that does not exist in WT. This result indicates that a population of high amplitude mIPSCs occurs exclusively in Gabra1–2 hippocampal slices.
Mann-Whitney tests were used to analyze mIPSC kinetics and tonic current data (#p < 0.05) and error bars represent mean ± SEM for these experiments. For (G) and (H), data are expressed as mean ± SEM amplitudes (pA) for each of the Gaussian components used to obtain optimal fits to the data.

