
FIGURE 6.
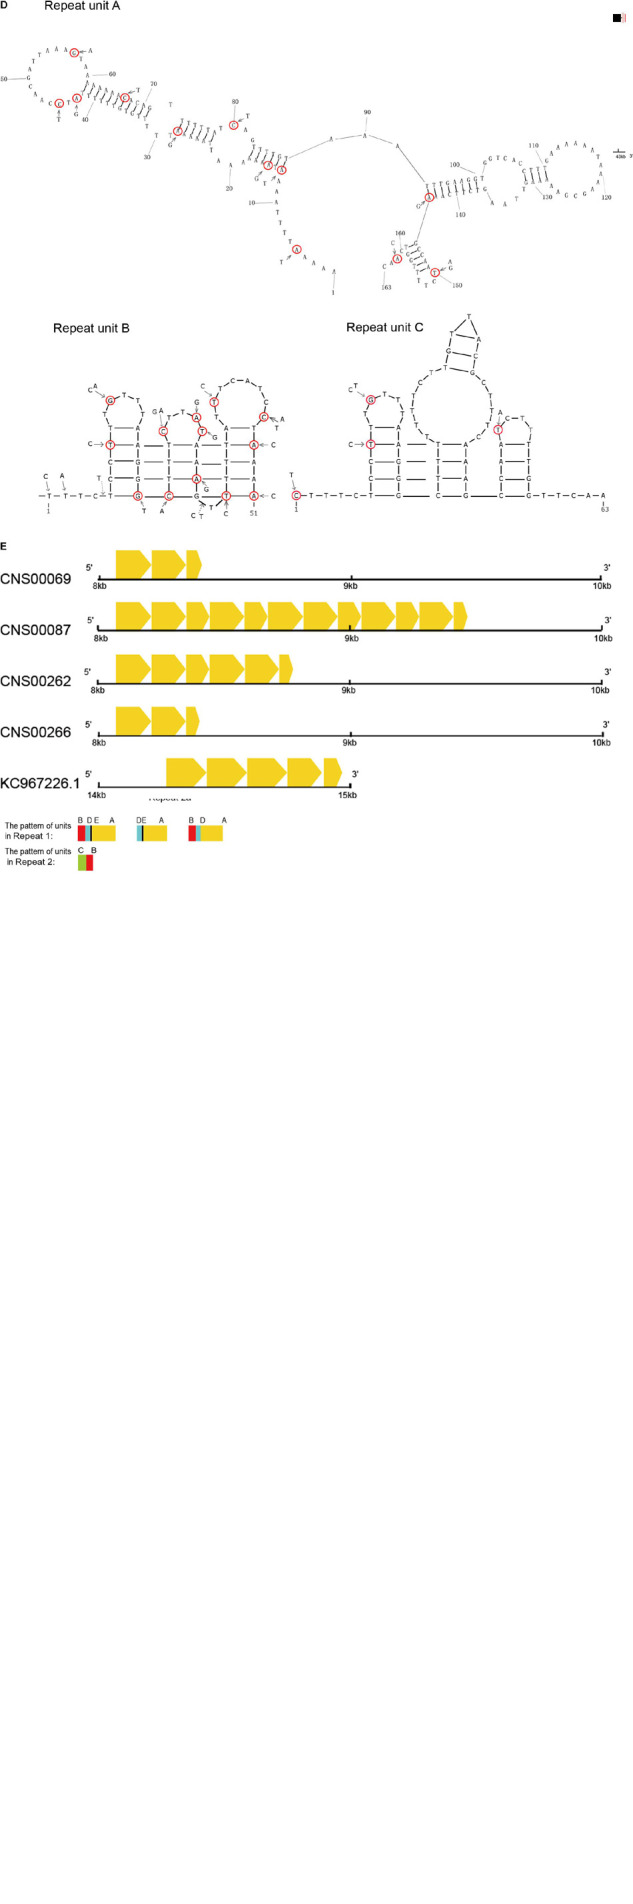
Repeat analysis of P. globosa. (A) Comparison of the repeat regions position and length among P. globosa strains. The black blocks represent the complete repeat regions, and their length was marked under blocks. The gray rectangle showed the end of the scaffold (marked with 1000N in the sequence), and this region is another repeat region which is unobtainable until now. The genome ends in a red vertical line. (B) Dot plot similarity matrix of P. globosa strain CNS00066 mtDNA against itself. Dots in the nucleotide similarity matrix represent regions of sequence similarity. The main diagonal represents the mtDNA on the x-axis matching against its partner of the y-axis, Dots adjacent to the main diagonal correspond to repeat DNA and the result indicated two large repeat regions. Dot plots were generated with Dotter under default parameters. (C) Repeat structures in P. globosa strain CNS00066 mtDNA. Six repeat units (A-F) of different length (13 bp-203 bp) were identified in repeat regions in the strain CNS00066. (D) Repeat units A, B, and C exhibit a strong potential to form hairpin secondary structures. (E) The repeat unit A showed variable length, sequence similarity and copy numbers among different strains. The yellow arrow boxes represent repeat unit A.