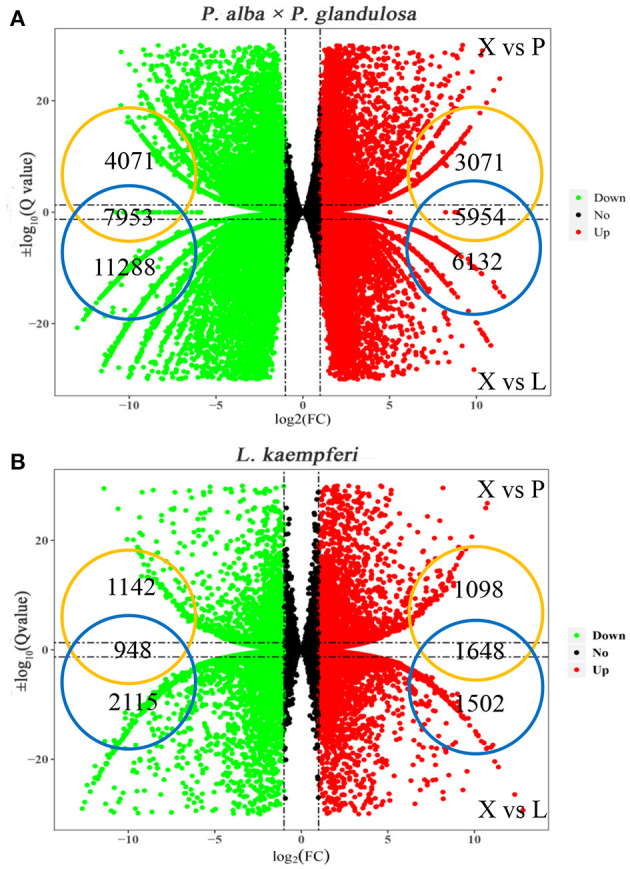
Figure 2.

Distributions of up- and down-regulated DEGs in the two tree species. (A) Up and down-regulated DEGs in P. alba × P. glandulosa. (B) Up and down-regulated DEGs in L. kaempferi. In both panels, X vs. P represents the differential expression analysis between the xylem and phloem; likewise, X vs. L represents the differential expressed analysis between the xylem and leaf. The vertical dotted lines correspond to the log2 (fold- change) = ±1, while the horizontal dotted lines are positioned at log10 (Q-value) = ±1.3 (Q-value = 0.05). The genes at the intersection of two groups are the up- and down-regulated genes in xylem tissue.
