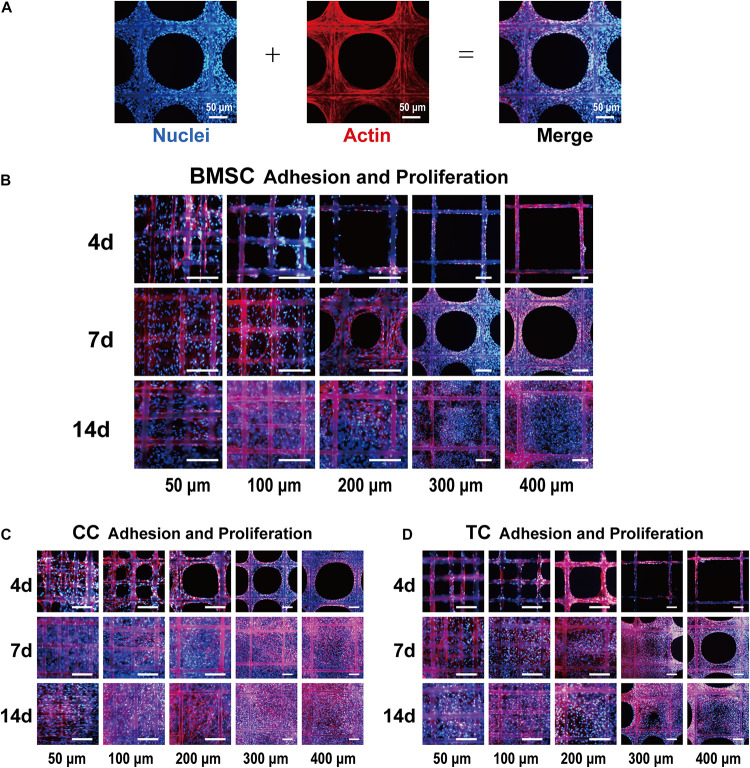
FIGURE 3.
Fluorescence images of bone marrow mesenchymal stem cell (BMSC) adhesion and proliferation. (A) Representative example of the cell-loaded scaffold. The left side shows a DAPI (blue)-labeled cell nucleus, the middle shows phalloidin (red)-labeled actin, and the right side shows the merged image. Fluorescence images of BMSCs (B), chondrocytes (C), and tendon cells (D) on 50-, 100-, 200-, 300-, and 400-μm porous scaffolds at 4, 7, and 14 days. Scale bar: 100 μm.

