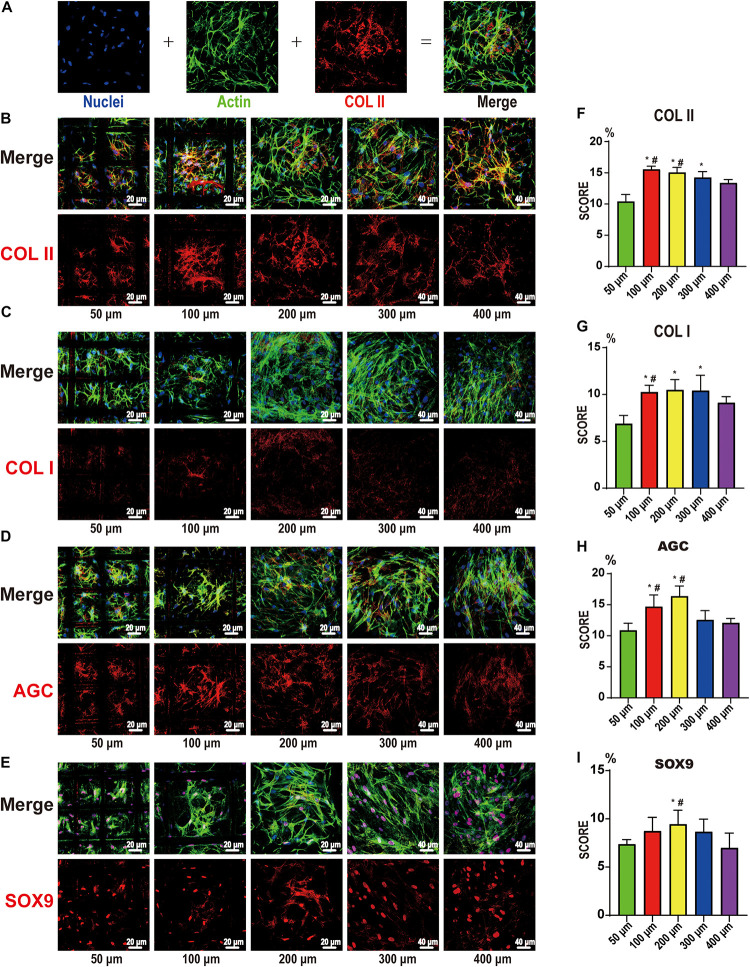
FIGURE 6.
Confocal microscopy for COL I, COL II, AGC, and SOX9. (A) Representative example of the confocal microscopy graph of 21-day chondrocyte differentiation from bone marrow mesenchymal stem cells. The first is DAPI (blue)-labeled nuclei, the second is phalloidin (green)-labeled actin, the third is COLII (red), and the fourth is a merged image. COL II (B), COL I (C), AGC (D), and SOX9 (E) on the 50-, 100-, 200-, 300-, and 400-μm-pore-size scaffolds. The upper part is the merged image, and the lower part is the protein image (red). Histogram of the results of COL II (F), COL I (G), AGC (H), and SOX9 (I) expression in image analysis. Data represent the mean ± standard deviation. n = 4; *p < 0.05, compared with the 50 μm groups, #p < 0.05, compared with the 400 μm groups.

