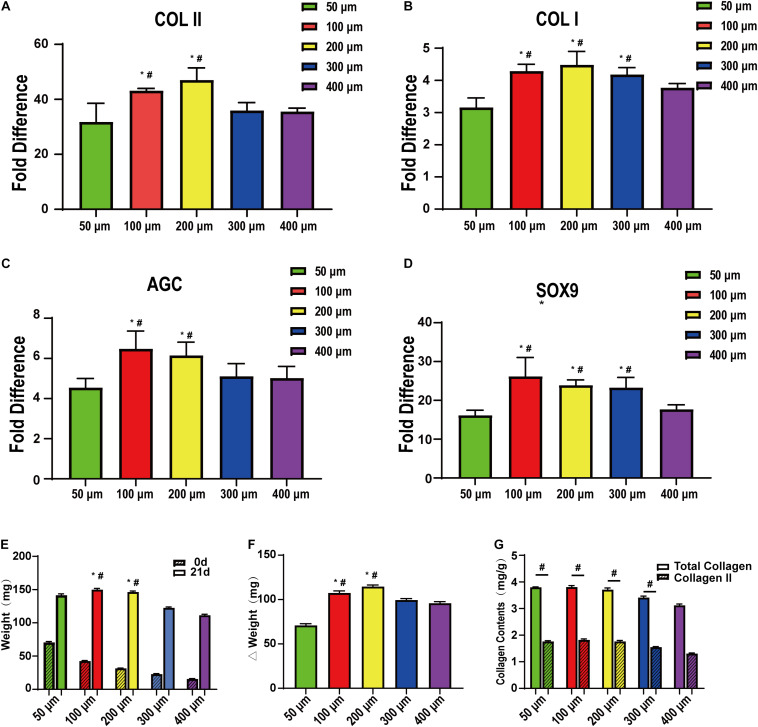
FIGURE 7.
qRT-PCR and quantitative biochemical analysis of bone marrow mesenchymal stem cells on the scaffolds after cartilage induction on 50-, 100-, 200-, 300-, and 400-μm-pore-size scaffolds for 21 days. (A) COLII, (B) COLI, (C) AGC, and (D) SOX9 (n = 5). (E) Simple scaffolds, cell-supported scaffold weight, and (F) their gap. (G) Total collagen and collagen II content on the scaffolds after cartilage induction on 50-, 100-, 200-, 300-, and 400-μm pore-size scaffolds for 21 days. Data represent the mean ± standard deviation. n = 4; *p < 0.05, compared with 50 μm groups, #p < 0.05, compared with 400 μm groups.

