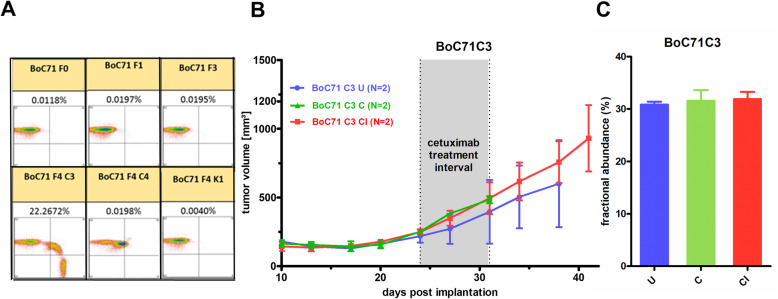
Fig. 6.
KRAS mutation fraction dynamics under treatment in CET SR BoC71 tumors. a KRAS-G12V specific BEAMing assay in BoC71 PDX models. Fluorescence dot plots are shown with wildtype population plotted on the Y-axis and mutant population on the x-axis. Only one sample (BoC71 F4 C3) showed a high percentage of G12V mutation, resulting in 22.27% mutant fraction. All other samples are negative for KRAS G12V, showing values below our detection limit of 0.02% mutant fraction. Sample BoC71 F4 C4 shows a strong shift of the majority of the wildtype population to the right uncharacteristic for the G12V mutation. This shift stems from the G12C KRAS mutation which this single KRAS analyte analysis cannot detect. F, PDX generation starting with F0; K, untreated control tumor; 5dC, 5 days CET treated; C, CET secondary resistant. b Growth curves of KRAS mutated SR tumor BoC71 C3 untreated (U), treated either only for the indicated time frame (shaded gray area) and taken out for analysis at the end of treatment or taken out following a treatment pause and doubling of the tumor volume (CI). c Fractional abundance of KRAS mutation determined by digital droplet PCR for corresponding experimental set-ups. Data are shown as mean values ± SEM (error bars)

