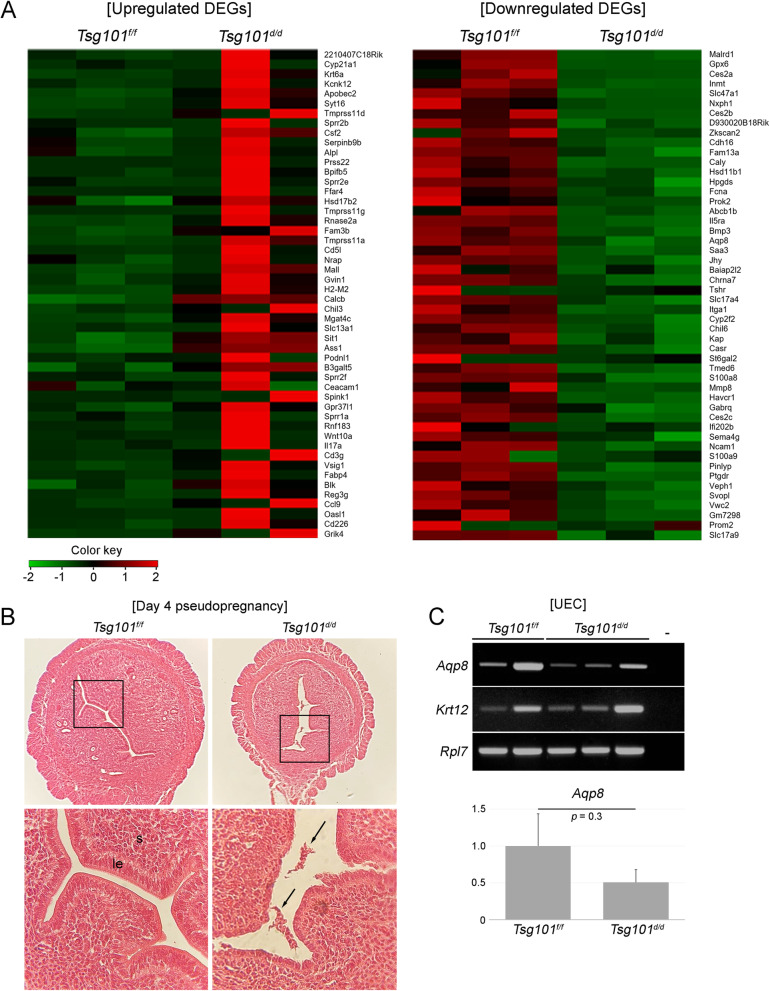
Fig. 6.
mRNA expression profiling in UECs from Tsg101f/f and Tsg101d/d mice. (A) Top 50 upregulated and downregulated genes are presented as heatmaps. For each sample, 3–5 mice were pooled. Three sets were prepared and shown in the figure (B) A representative histological image of day 4 pseudopregnant uteri used for mRNA expression profiling. Arrows indicate detached epithelial tissues in a Tsg101d/d uterus. le, luminal epithelium; s, stroma. Experiments were repeated two times with similar results. One representative set is shown. (C) RT-PCR analyses of Aqp8 in UEC RNA samples. Two Tsg101f/f UEC and three Tsg101d/d UEC samples were used. -, no RT. The gene expression of Aqp8 was normalized with Rpl7 levels. No significant difference between samples was observed

